

A Close Look at U.S. GDP, Part 1
A Close Look at U.S. GDP, Part 1
The first quarter’s report can best be described as weird

· The first quarter GDP report held some strange and seemingly contradictory data points. If a GDP report can be boiled down to one word the first quarter’s report can best be described as weird.
· There are encouraging signs of a healthy and necessary rebalancing of consumption away from goods and back to services. Unfortunately, that rebalancing is taking place at breakneck speed as accelerating price growth in durable goods sets off a deflationary “buyer’s strike”.
· The problem for the Fed, with its heavy emphasis on consumer demand, is that the scale of interest rates needed to rebalance the production side of the economy is likely to be enough to sink the consumer side of the economy.
The surprise decline in first quarter U.S. gross domestic product set off alarm bells in newsrooms and on trading floors but, on closer inspection, elicited a collective shrug from commentators. If a GDP report can be boiled down to one word the first quarter’s report can best be described as weird. This note and its companion will closely examine the consumption and production sides of the economy, respectively, seeking an understanding of the true state of the U.S. economy.
Weird, or Just Wrong?
Of course, the big caveat that hangs over all economic discussions right now is that at times of economic turbulence and change the official data is subject to large revisions. Indeed, as I discussed recently[1], the Bureau of Labor Statistics predictably undercounted employment in 2021 and the data was revised up by over a million this January. However, as discussed in that note, by using a first principles-based analysis we can find places where contradictions in different data sets indicate something is wrong with the count. In contrast, statistical-based approaches take the data as a given and try to fit an understanding of reality into the data – whether that data be right or wrong. The ability to avoid the trap of deductive reasoning using faulty data is what distinguishes the inductive reasoning approach, commonly referred to as “Austrian”, used by this writer. Austrians trade the false precision of statistical forecasts for a richer understanding. Understanding allows for making decisions beyond what GDP forecasts can provide when plugged into an earnings model.
The first indication that the decline was a sign of broader economic dislocation and not simply a data blip is that the big swing factors have been related to the movement and storage of goods. Most notably, in the perversity of GDP calculations, the large build in private inventories counted as a negative against GDP because the build was less than the build in the fourth quarter (Charts 1 & 2). A rebuilding of inventories is a necessary and good thing, so one might be inclined to exclude that from the GDP report and focus on the healthy consumption data. However, as will be shown in this note and the next, a Herculean effort by the supply chain was needed to keep goods flowing to consumers. That effort was successful but came at the cost of further dislocating the manufacturing sector supply chain. Squeals by consumers about shortages led to regulators prioritizing the movement of consumer goods over the shipment of manufacturing inputs.
Personal consumption expenditure continued growing at a healthy pace in the first quarter, right on trend (Chart 3). But the news was not all good because hitting those consumption targets has required a steady erosion of the savings rate below pre-COVID levels (Chart 4). I’ve written multiple notes in recent months pointing to consumer credit as a key driver of inflationary and deflationary pressure[2]. Growing use of credit cards to pay for necessities points to a powerful inflationary impulse that the Fed has limited means to control directly.
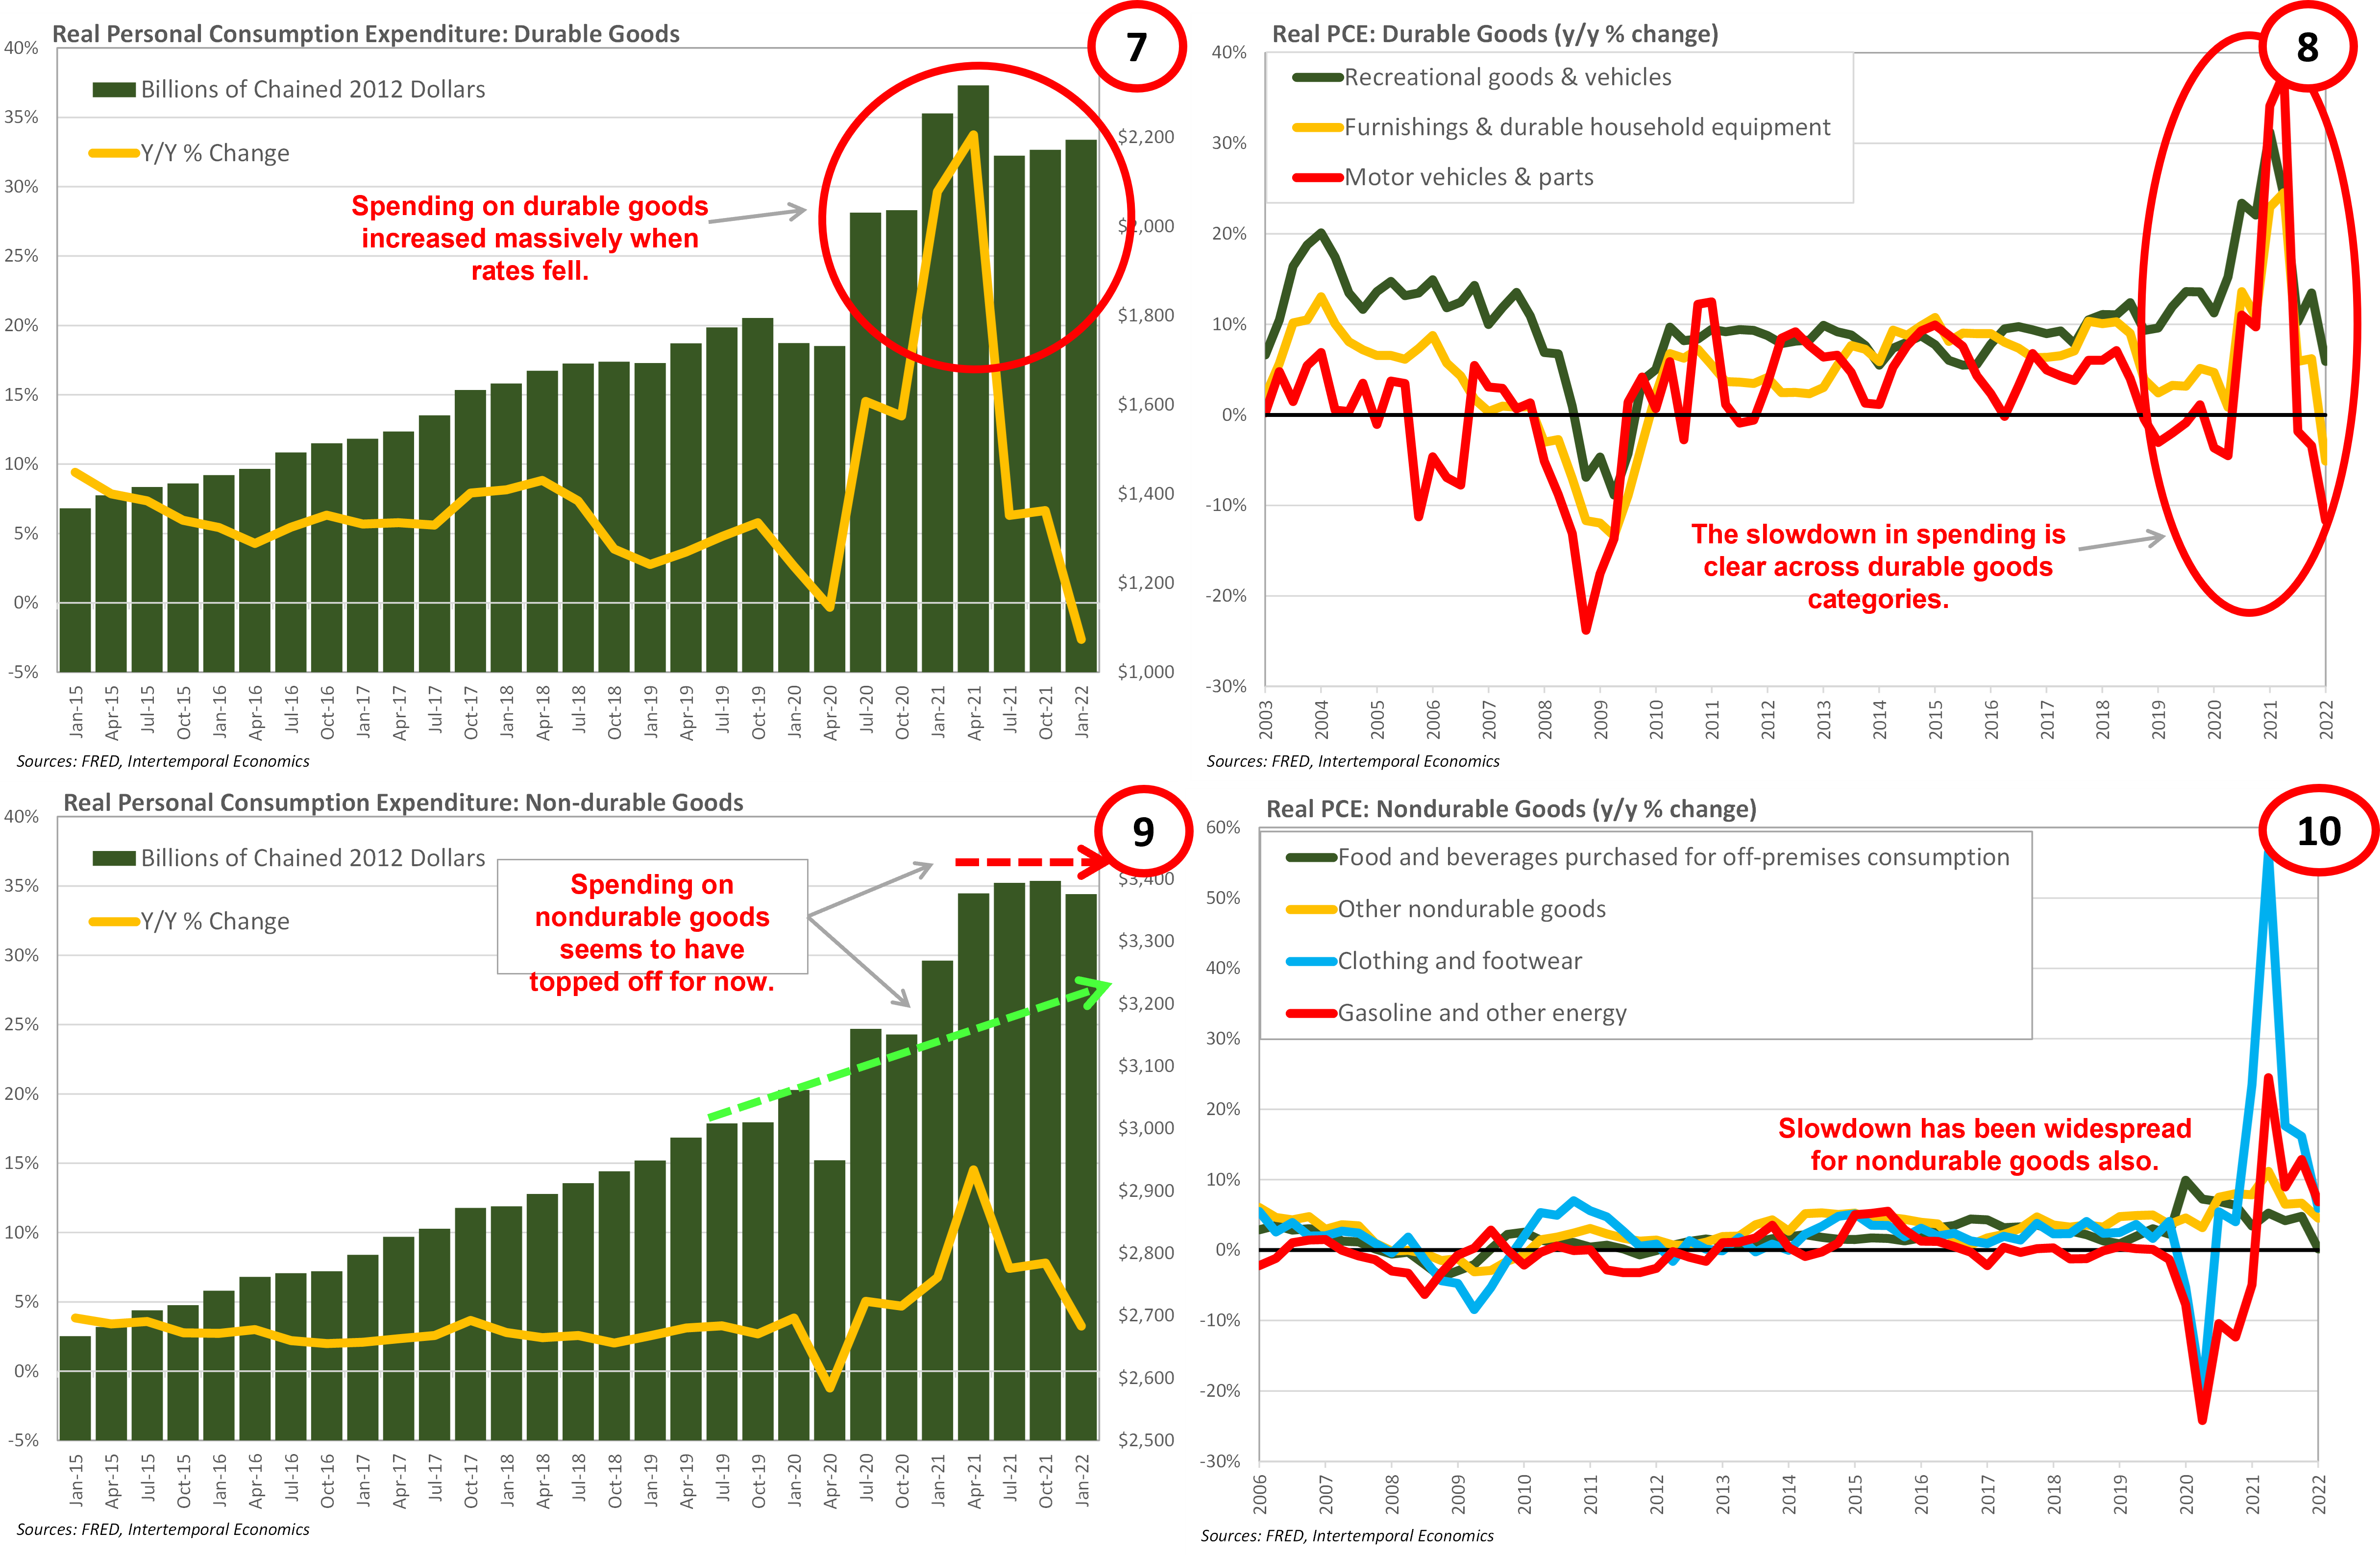
There are encouraging signs of a healthy and necessary rebalancing of consumption away from goods and back to services (Chart 5). Unfortunately, that rebalancing is taking place at breakneck speed as accelerating price growth in durable goods sets off a deflationary “buyer’s strike” amid expectations of tighter monetary policy (Chart 6). Consider that spending in real terms on durable goods remains about $500 billion above pre-COVID levels and perhaps $300 billion above where the pre-COVID trend growth would be now (Chart 7). Spending on nondurable goods remains about $200 billion above where the pre-COVID trend would be now (Chart 9). Except for spending on energy, spending on all categories of durable and nondurable goods is headed back to its pre-COVID trend (Charts 8 & 10). If that process occurs too quickly for businesses to adjust, retailers could be left with large quantities of unwanted inventory.

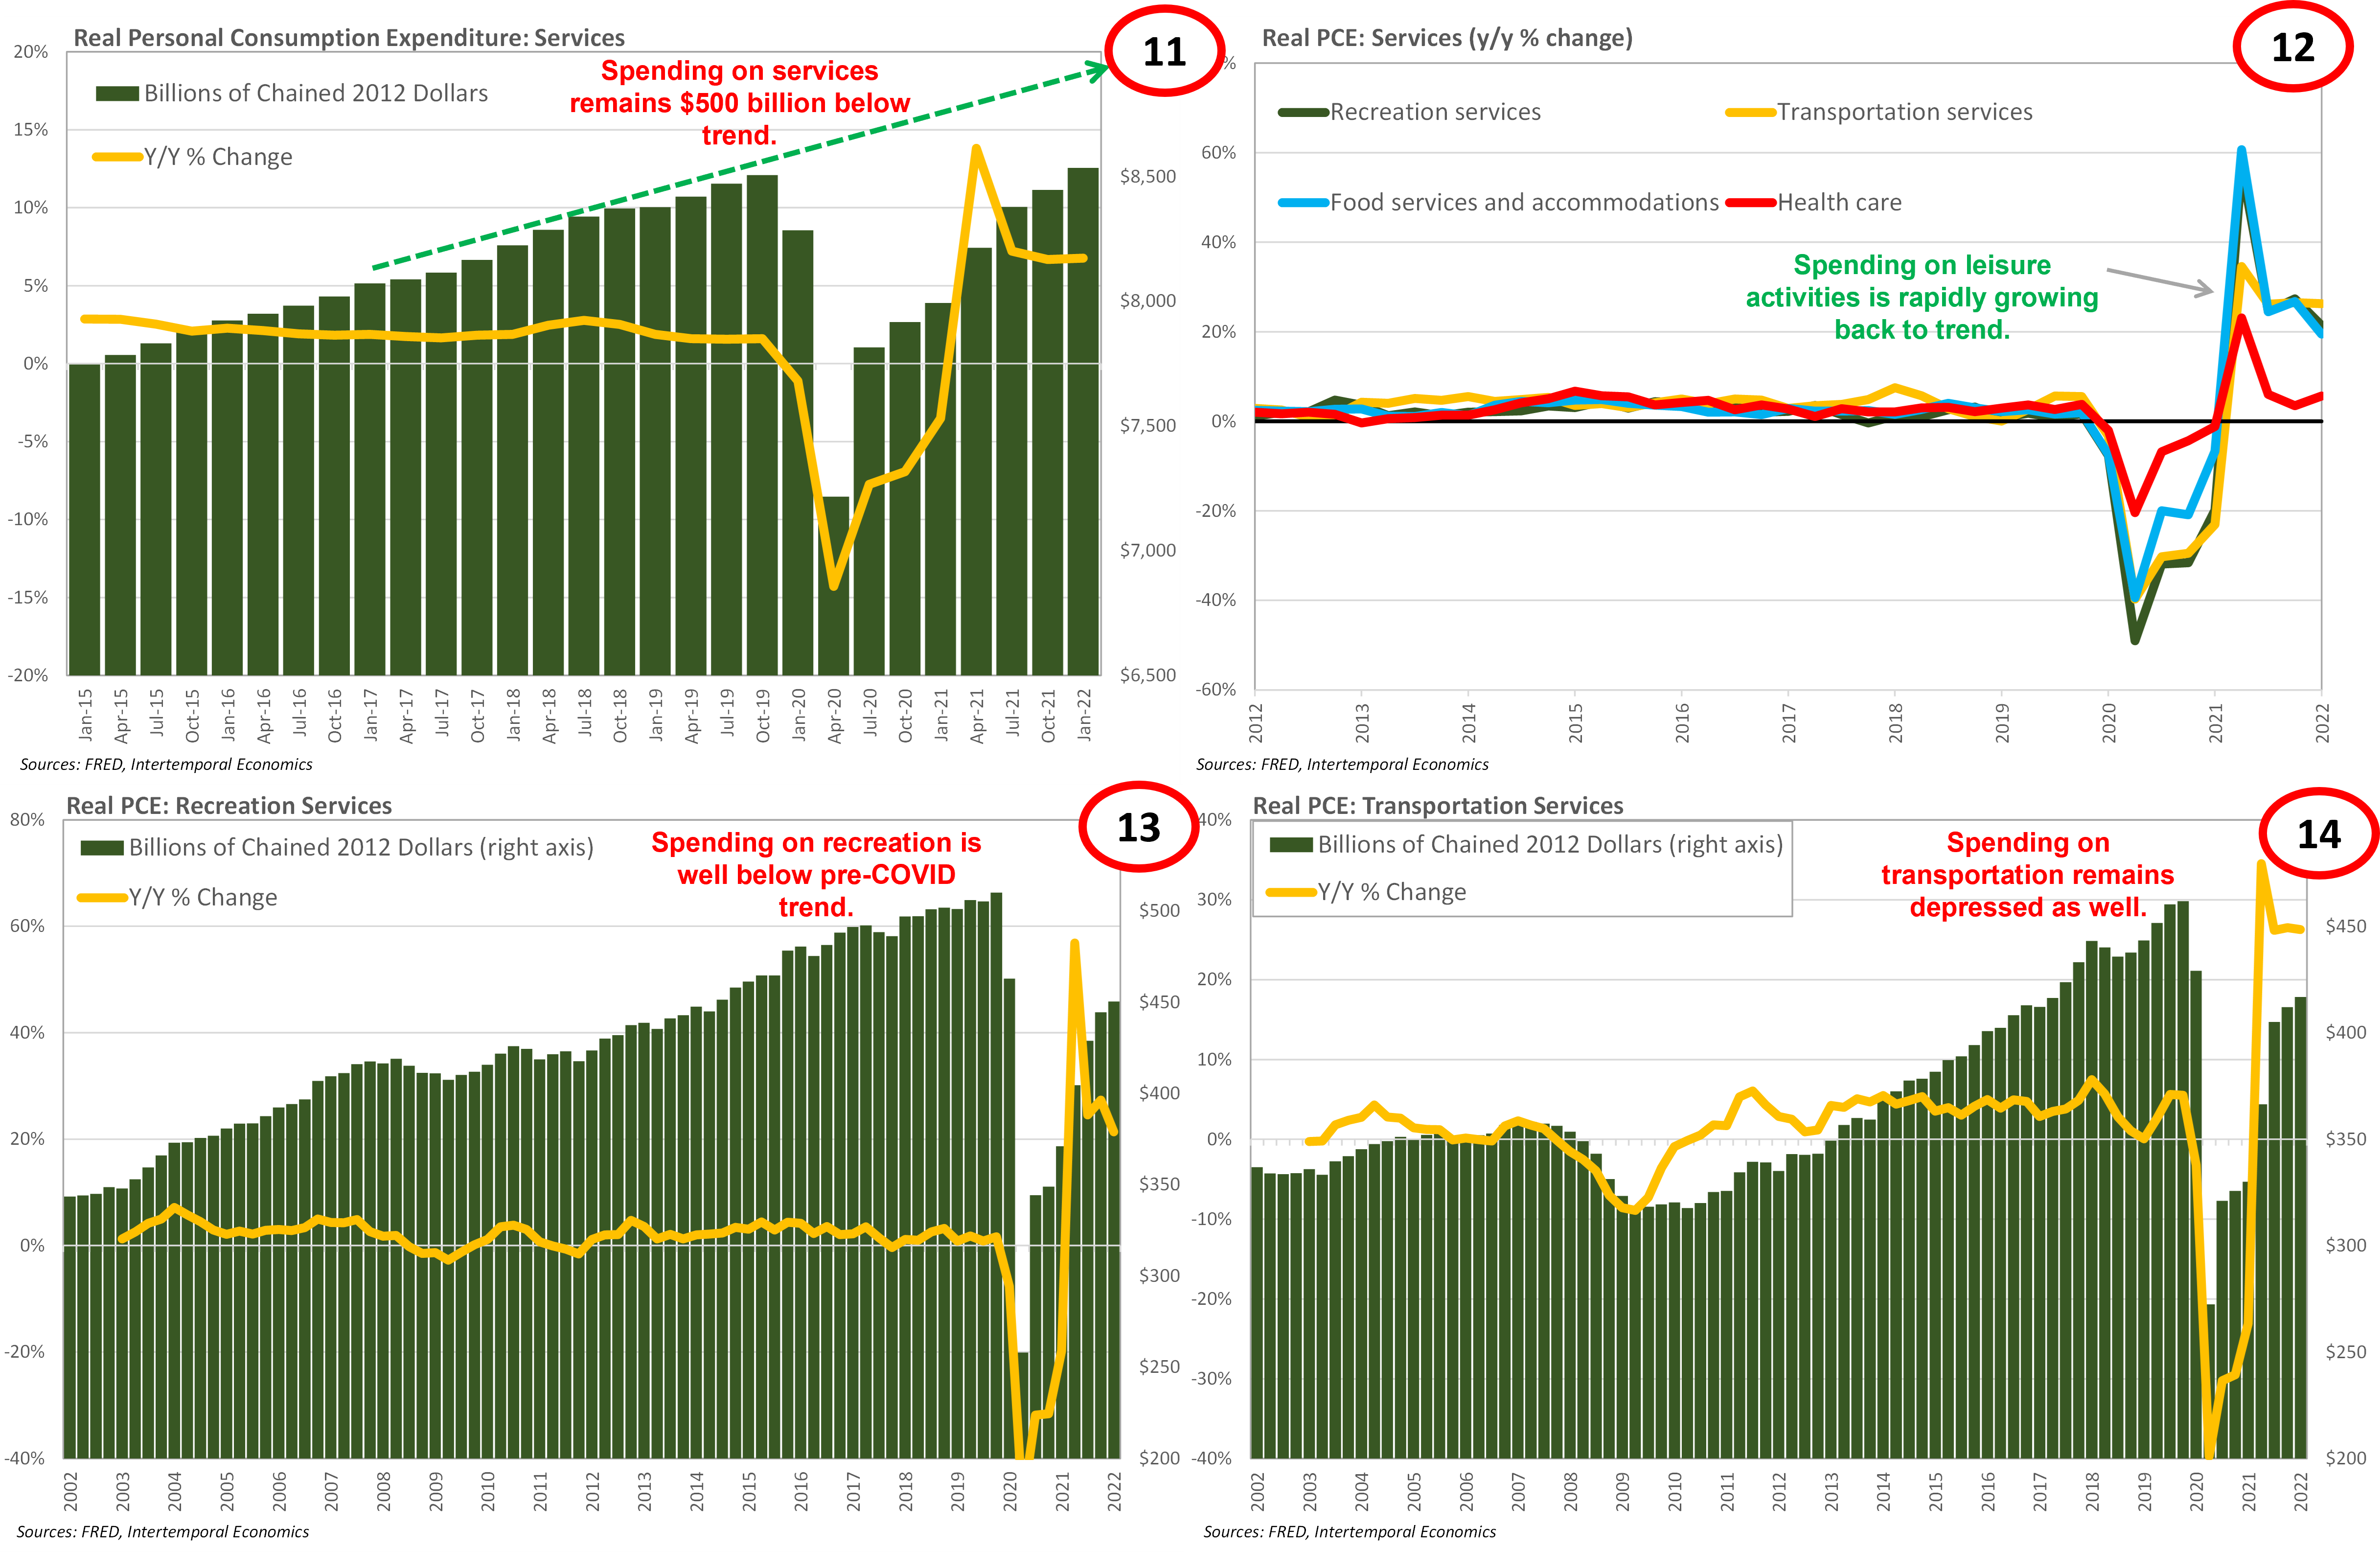
In a benign scenario consumption smoothly shifts from goods to services, alleviating inflationary pressure from the supply chain and allowing a rebalancing to occur without a recession. The good news is that demand clearly is flowing to services rapidly, especially leisure and recreation (Charts 11 & 12). However, here we run into the same coordination problem that occurred with goods. Note that spending on recreation and transportation remain well below their pre-COVID levels (Charts 13 & 14). Consider the crush of demand as consumers rush out to amusement parks and concerts. We know that restaurants, hotels, and healthcare providers have all struggled to find enough workers. Note that spending on services from the ‘Food and Accommodation’ and ‘Health care’ industries has returned to pre-COVID levels (Charts 15 & 16). These industries ran into capacity pressure as soon as demand ramped up and that pressure is likely to grow worse as demand ramps up across the services sector. A reduction in price pressure on goods could quickly be replaced by extreme upward pressure on wages as demand shifts to services.
Breaking the Chain
When compared with the Great Recession, the hit to demand caused by COVID looks like merely a flash in the pan (Chart 17). But looks can be deceiving and the “buyer’s strike” taking place in durable consumer goods is a major obstacle to avoiding recession (Chart 18). The situation at present is one where overall demand has been maintained on the momentum of strong demand for durable goods. The need to increase interest rates to allow the supply chains of these goods to catch up creates a terrible dilemma for the Fed. Demand for everything is higher because demand for durable goods is so strong.
Raising interest rates to reduce demand pressure on durable goods will not simply shift demand to other goods or to services. Instead, raising interest rates will have the effect of shifting demand across time – causing current demand for all goods and services to decline and be shifted towards the future. The imbalance in demand is intertemporal, rather than simply an imbalance between goods and services in the present.
This brings us to one of the main drivers of the decline in measured GDP and a reason for concern that has gone relatively unnoticed – the terrible performance of net exports (Chart 19). Note that the shifts in demand caused by the pandemic caused the trade deficit to blow out, seriously cutting U.S. GDP by meeting internal demand with external production. Imports of non-petroleum goods have grown at a frightening pace since their Q1 2020 crash (Chart 20).

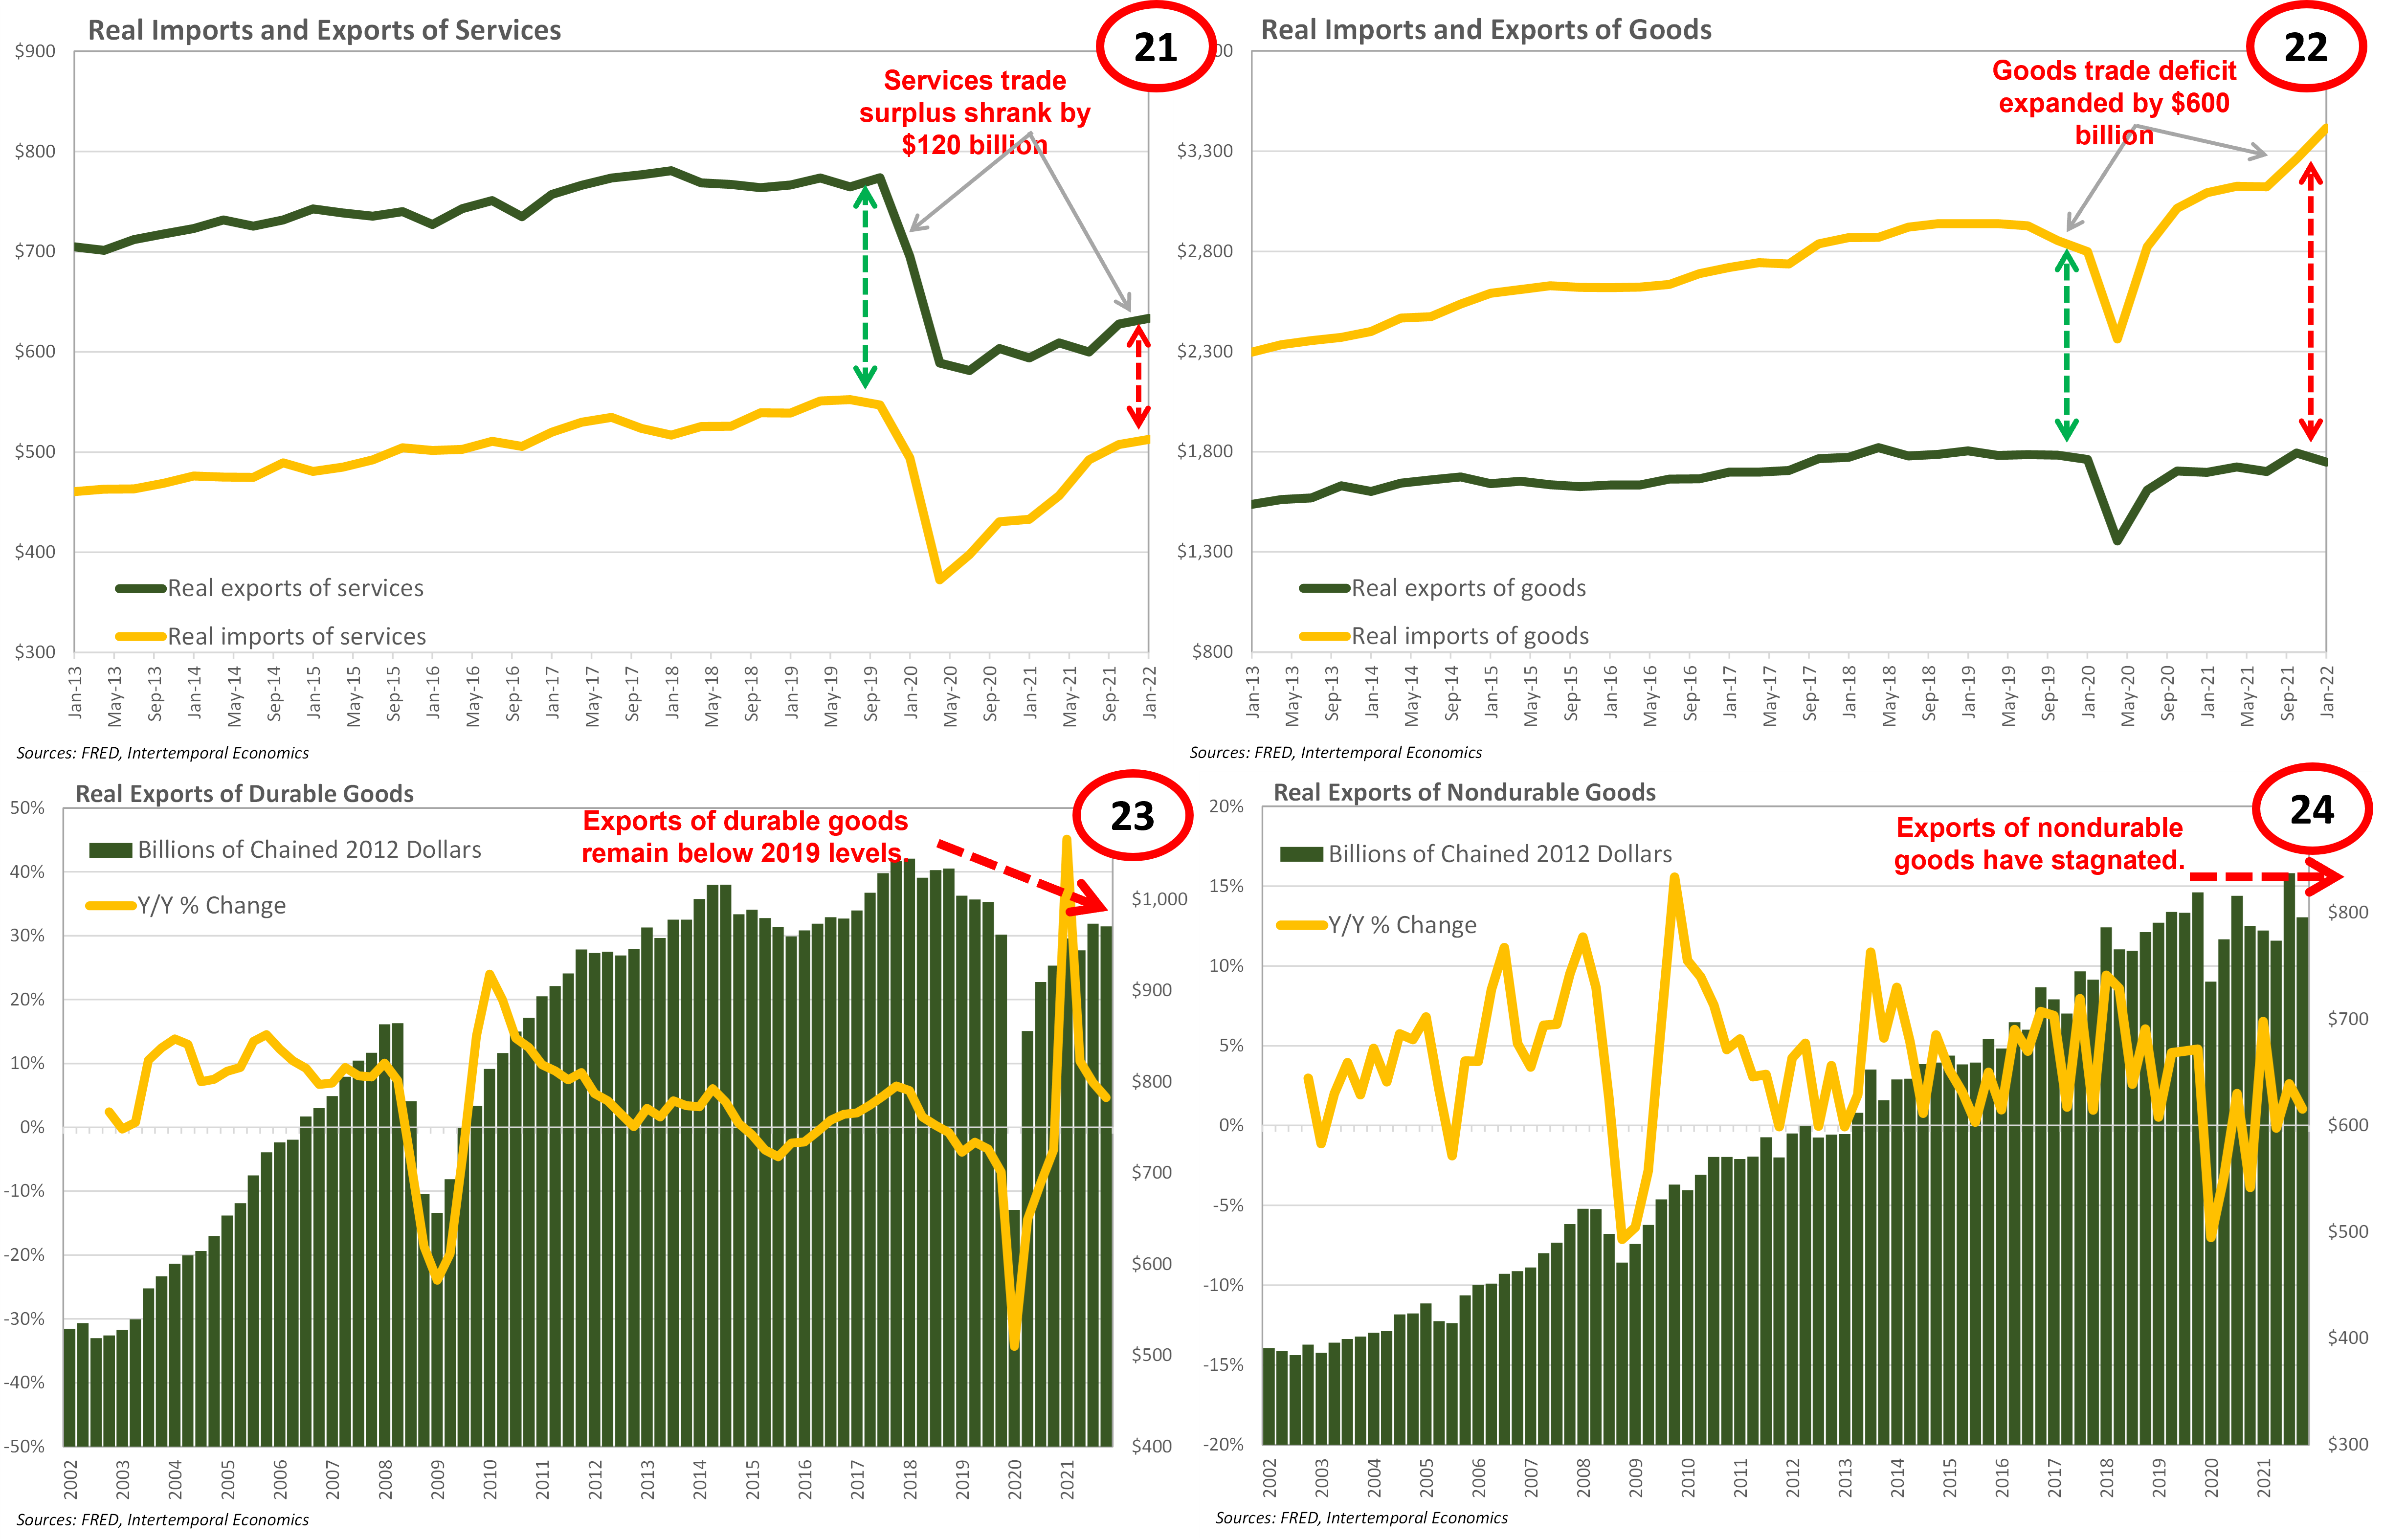
The trade deficit for goods gets all the attention, but one noteworthy aspect of the current situation is that the trade surplus for services shrank by over one-hundred billion dollars when compared with its pre-COVID size (Chart 21). That is driven by the decline in incoming international travel (which is a service “export”) and provides another source of unwanted inflation should travel conditions normalize.
The real story is in the trade deficit for goods, which has partly been driven by a massive increase in imports, but also has a component of a stagnation of exports (Chart 22). Most notably, real exports of durable goods did not grow on a quarterly basis in Q1 and remain almost one-hundred billion dollars short of pre-COVID levels (Chart 23). Real exports of non-durable goods have stopped growing for the first time in twenty years (Chart 24).
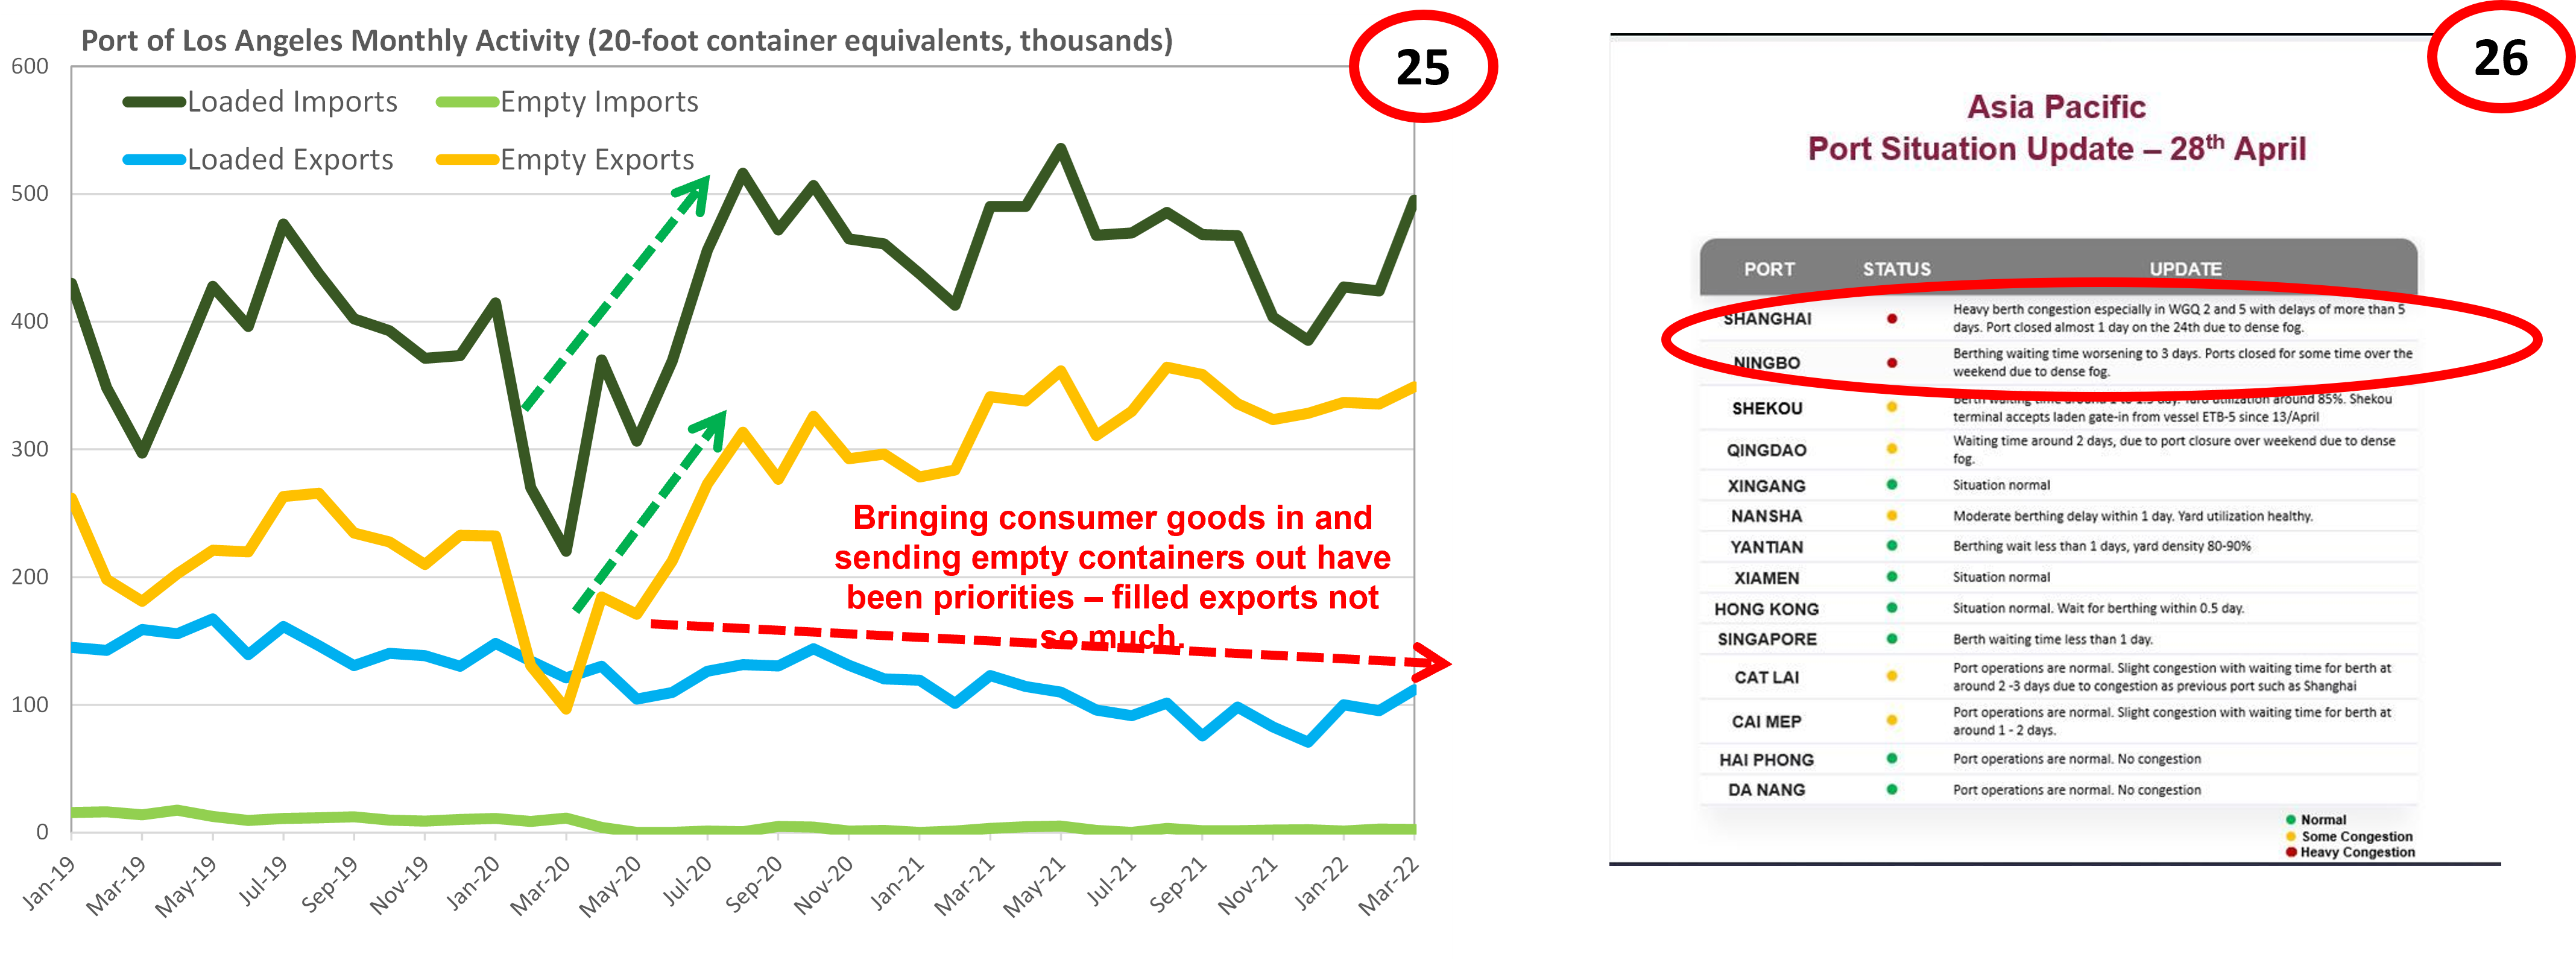
The reason for such poor export performance in the U.S. has been the myopic focus on imports by west coast U.S. ports. In their rush to process imports and get ships out of berth, port operators have been criticized for letting U.S. exports languish in warehouses. Indeed, the Port of LA continues shipping out 3.5 empty containers for every filled container (Chart 35). The problem is likely to get worse when the effects of the COVID shutdown in Shanghai starts to hit U.S. ports, causing yet more bottlenecks (Chart 26). The disruption of U.S. exports has created a problem in the manufacturing supply chain that has not yet been realized by the market or policymakers.
The Inventory Boomerang
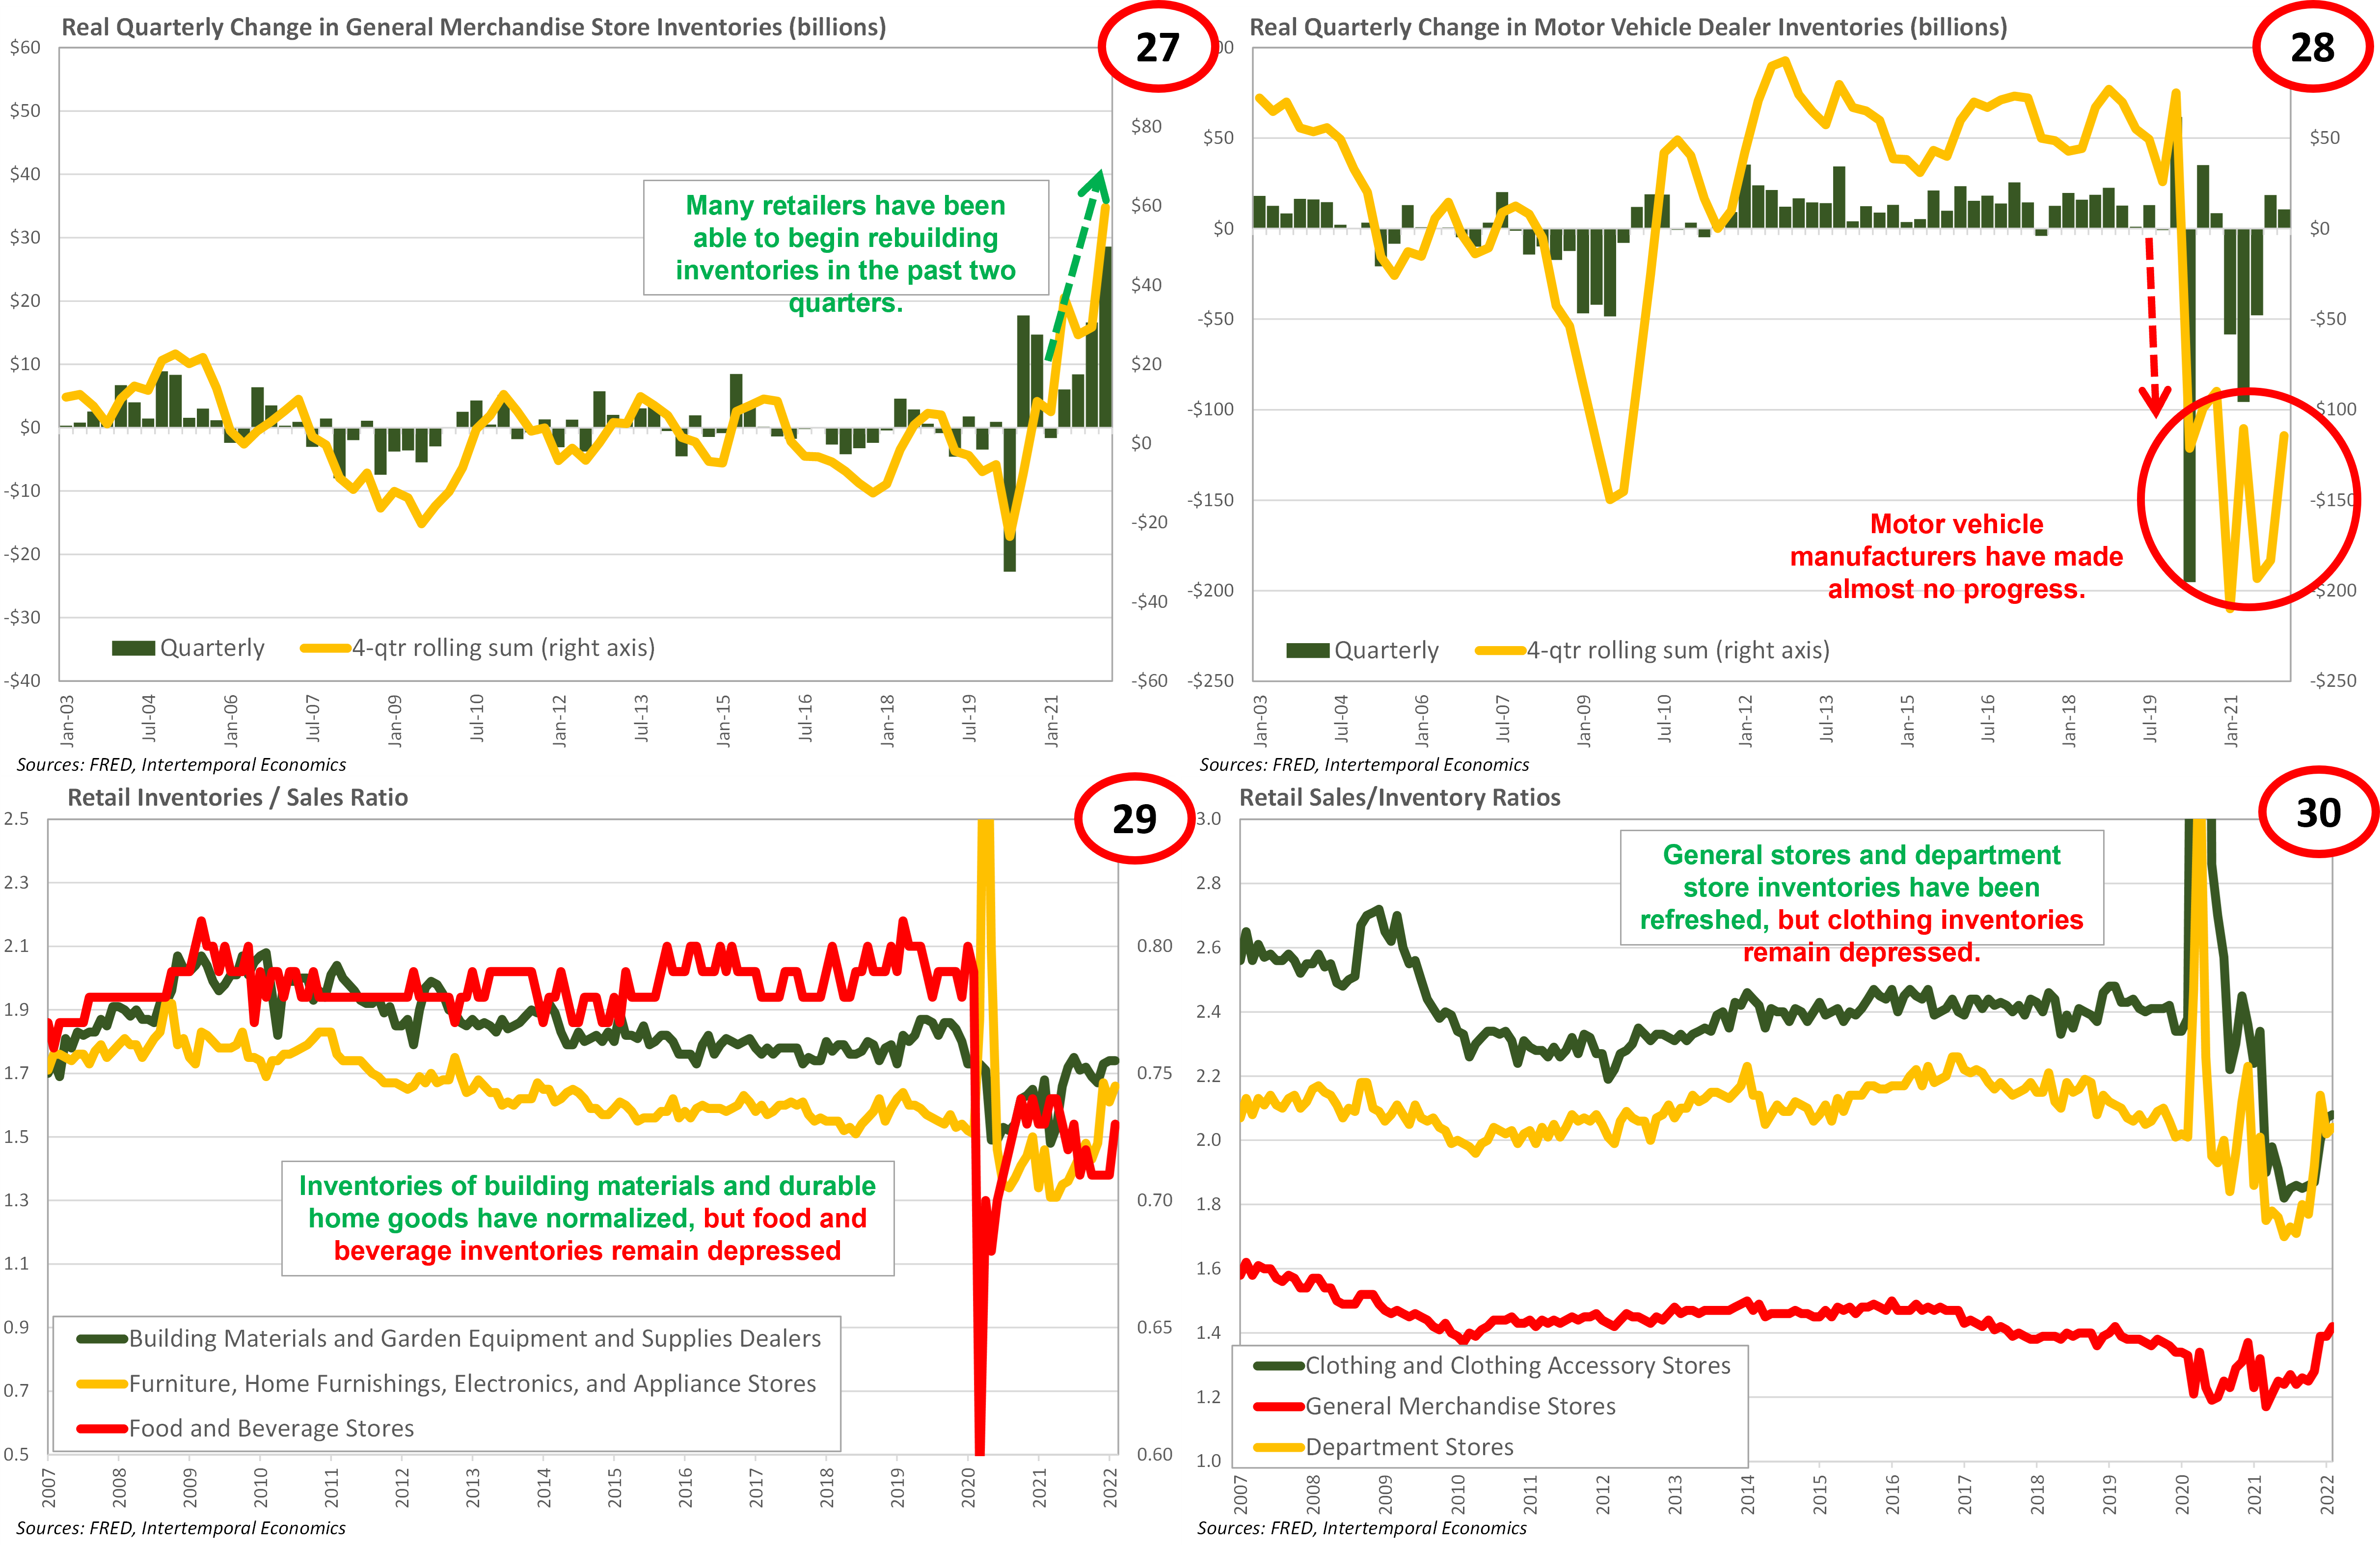
The good news is that inventories of consumer goods, including appliances and furniture, are normalizing rapidly (Chart 27 & 30). The bad news is that inventories for motor vehicles and food remain depressed (Charts 28 & 29). This writer is not concerned about famine in the U.S., but there could be a period of sustained food price inflation that increases household inflation expectations. If that occurs, the Fed will be forced to be tighter than the market expects, but at least the correct course of action would be clear.
Much more difficult to manage from a monetary policy perspective is a shortage of inventories in the manufacturing sector, which shows up for consumers as a shortage of vehicles. However, as we shall see in part two of this note, supply chain problems persist across the manufacturing sector. The emphasis on getting consumer goods to market in the U.S. has left manufacturers globally with a shortage of components manufactured in the U.S. That could have a severe inflationary effect as shortages of capital goods start showing up. The problem for the Fed, with its heavy emphasis on consumer demand, is that the scale of interest rates needed to rebalance the production side of the economy is likely to be enough to sink the consumer side of the economy.
Conclusion
The first quarter GDP report held some strange and seemingly contradictory data points. Given economic turbulence and supply chain uncertainty, a large revision to the data would not be surprising. However, when taken with other data, the GDP report clearly indicates a state of dislocation between the demand and supply sides of the economy. Consumers are nervous but have maintained consumption and are in the process of moving consumption towards services as the pandemic fades. However, as will be discussed in Part 2, the supply side of the economy remains severely dislocated with inventories far below healthy levels. As we shall see in the next note, the economy is going to be hit by cross currents of inflation and deflation from the supply side of the economy and it will be very hard for the Fed to prevent a period of inflation volatility followed by recession.
[1] See my note “Employment, Inflation, and Policy Errors: They Did It Again!” of 20 February 2022.
[2] See my notes “Inflation to Deflation Through Consumer Credit” of 16 April 2022 and “Credit Cards: Inflation Acceleration Mechanism” of 3 December 2021.