


Growth Cycles and Turning Points
Growth Cycles and Turning Points
Economists Predicted Nine of the Last Five Recessions!

This note was sent to my institutional clients on March 30, 2019 at a time when the widespread discussion in the market was over whether the U.S. was entering a recession. I made reference to this note recently and am now releasing it on Substack for the benefit of readers here.
The apparent slowdown of the US economy in Q1 was the result of capacity limits and, for international freight, the completion of a global inventory restocking. Inflationary pressure will not recede as economic growth slows back to a reduced potential growth rate.
Consumers have been shielded from capacity-driven price increases by businesses accepting lower profit margins, but that can only go on for so long. A slowdown in growth will not be enough to ease transport capacity constraints unless capacity grows faster than trend GDP growth.
Analysts frequently use the first sign of a growth slowdown (i.e. the second derivative) as a signal for an oncoming recession. A better strategy is to incorporate the third derivative via freight transportation and warehousing data.
Nine of the Last Five
A frequent and, unfortunately, not undeserved criticism of economists is that they have “predicted” nine of the last five recessions. The over-production of recession warnings is the result of poorly designed incentives. Nobody cares who was second to “predict” a recession, so incentives are heavily tilted toward being the first to call the next “big one”.
To speed up their recession predictions (i.e. first derivative of GDP) analysts remove an assumed rate of trend growth from the actual growth rate. The second derivative of GDP is used to signal upcoming recessions. The rule becomes: “If growth is at or below trend and the second derivative is negative (i.e. growth is decelerating), then ring the recession alarm”. This strategy works if you are pretty sure what the trend rate of growth is, and the trend rate remains stable. Otherwise, it becomes unclear whether a growth slowdown is a directional move towards recession or a reversion to trend.
Diagrams A and B below lay out a stylized example. In Diagram A, GDP growth starts at Point #1 at its long-term trend. There is an “Area of Uncertainty” where a deviation from trend does not generate recession warnings. As GDP growth decelerates towards the lower border of the uncertainty zone a game of “Chicken” begins. Who will be first to use the second derivative as a directional indicator for the first derivative (i.e. a switch from expansion to recession)? If the trend growth rate is stable and can be estimated an analyst can take a calculated risk of calling a recession and expecting to end up at Point #2.
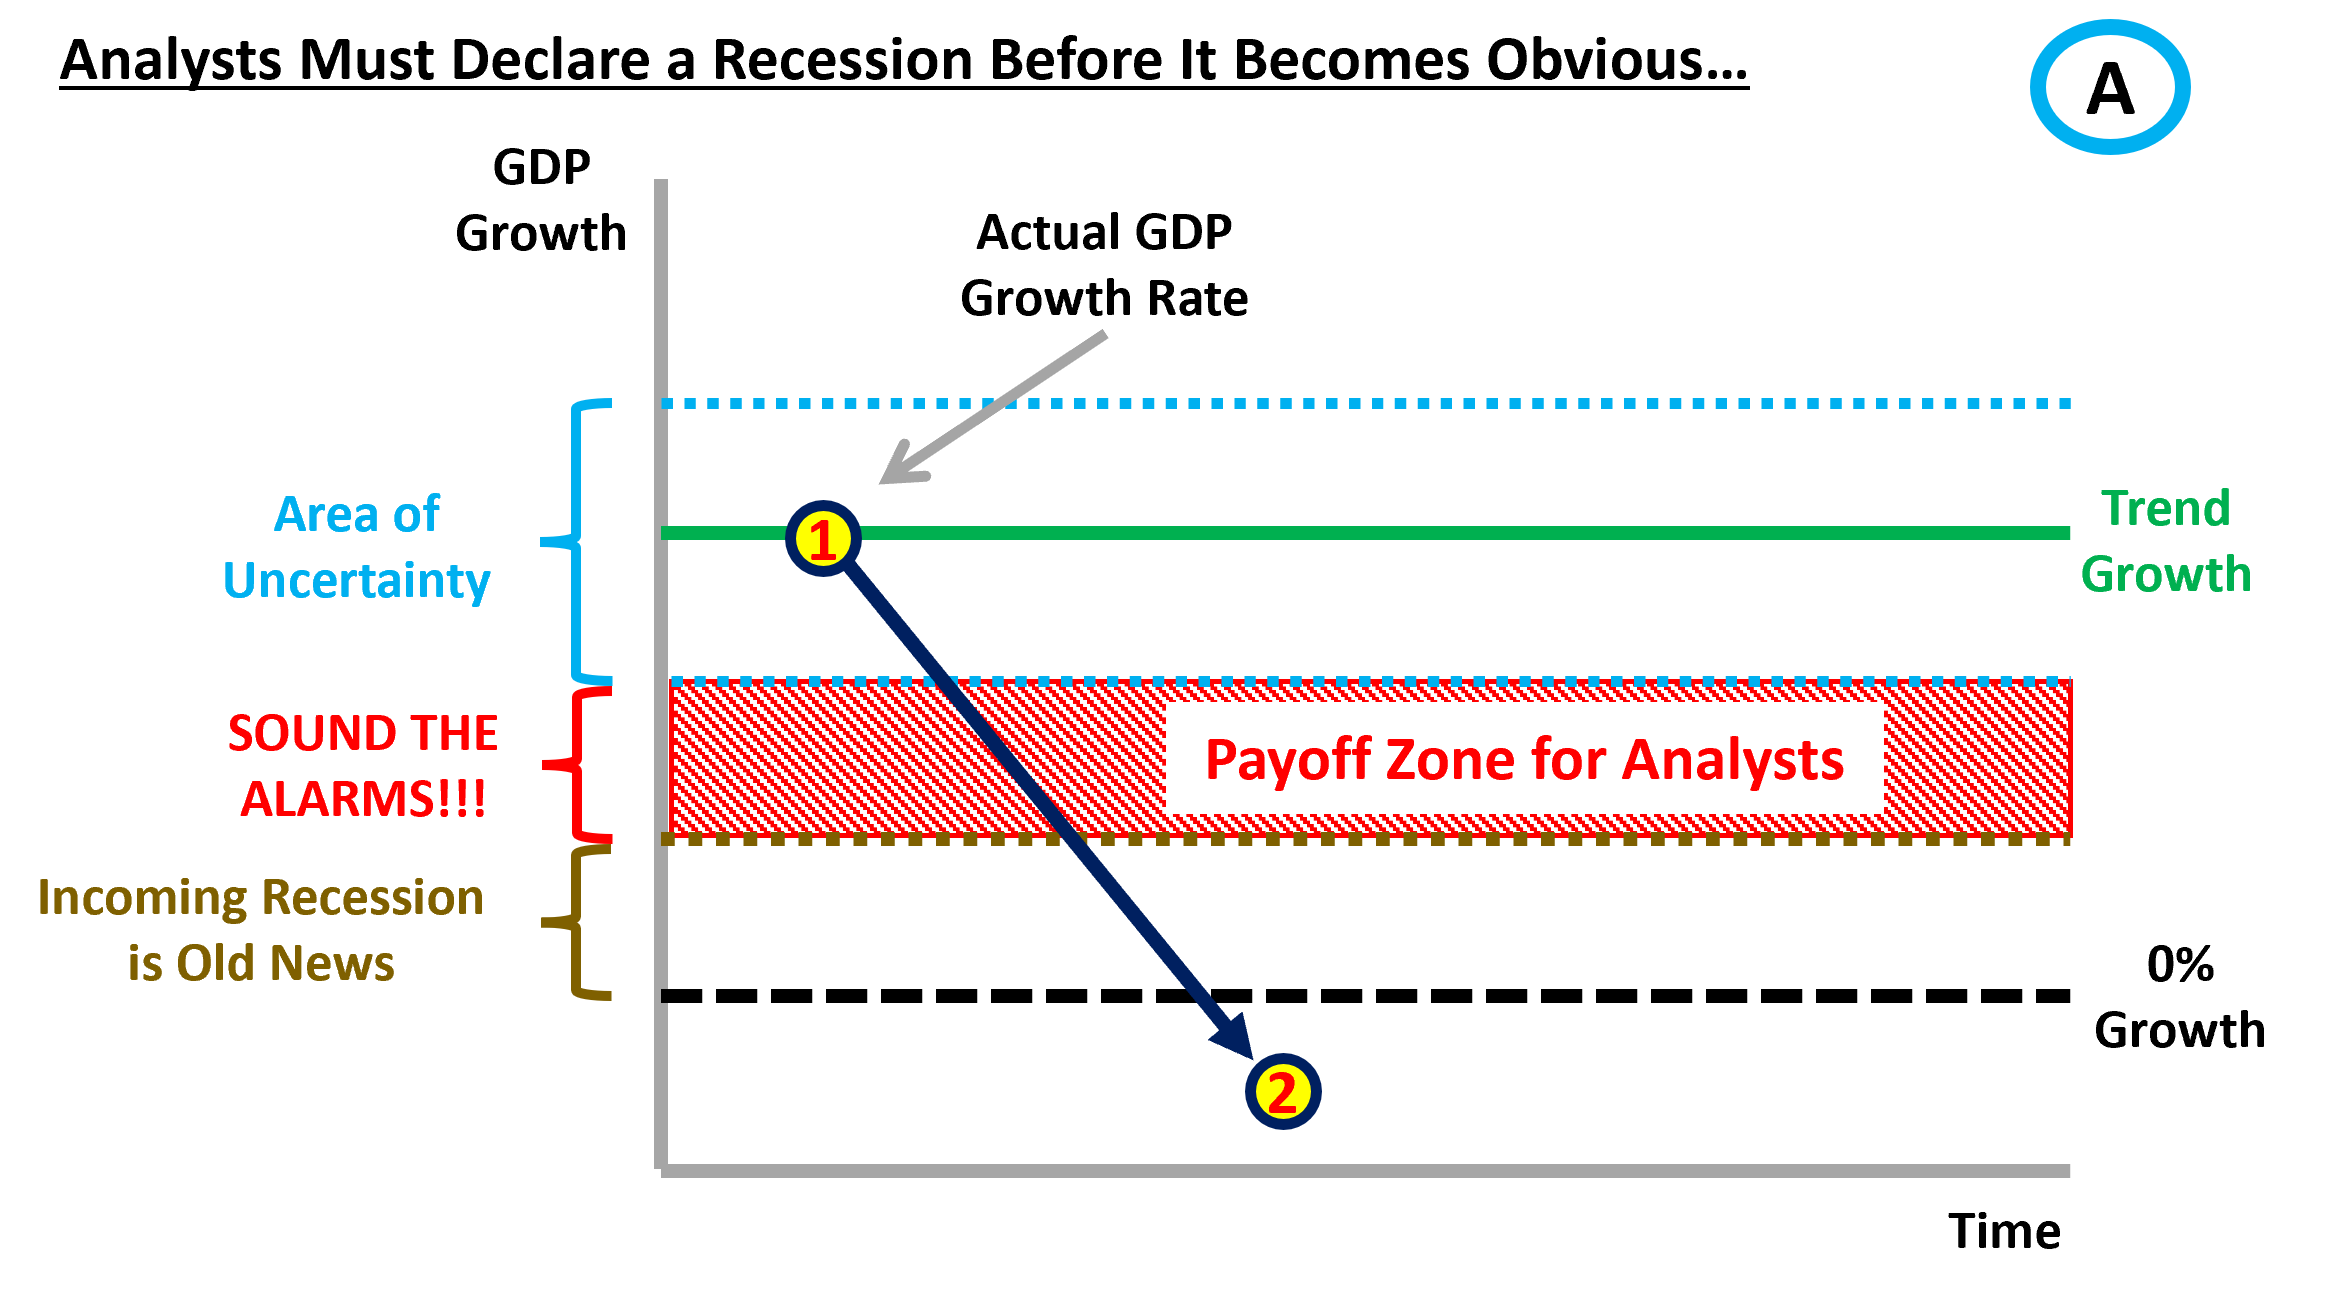
Diagram B shows a situation where the trend growth rate has shifted to a lower rate that is unknown to analysts. The job of analysts has become much more complicated in this scenario. The move from Point #1 to Point #2 will surely grab Wall Street’s attention and by the time GDP growth decelerates to Point #3 analysts are racing to declare a recession is coming because the second derivative has stayed negative and growth has continued to decelerate. Point #4 is where the US economy was in 2017 and 2018, stimulus boosted actual growth to what used to be trend and in 2019 growth will decelerate towards trend. The deceleration is necessary and unavoidable. Indeed, to the extent future growth expectations are revised down, growth could end up at Point #5, below the now lower trend growth rate, without a recession occurring.

Instead of looking to the second derivative as a directional indicator, analysts should be looking for the third derivative of GDP. As mentioned above, without knowing the trend growth rate ex ante it is hard to say whether a slowdown is a dive into recession or an appropriate and necessary slowdown back to trend growth. In my opinion, the best way to determine the direction of GDP (i.e. expansion or recession) is to look at the resistance points to the rate of growth. The question that needs to be answered is: “Where does the acceleration or deceleration of GDP growth run out of steam?” Note that “growth cycles” are changes in the rate of growth and occur frequently within larger “business cycles”, which are the expansion/contraction cycles that receive so much attention.

By using hard data from the transportation sector, changes in the rate of growth can be differentiated from the precursors of a recession. After detrending, the Transportation Services Index (TSI) provides an excellent leading indicator for changes in GDP growth. Chart 1 below shows movements of the de-trended TSI going back to 1979. There is clearly a tight relationship between changes in the rate of GDP growth and changes in freight transport activity. The TSI provides a reliable 4-6-month time horizon for an acceleration or deceleration of GDP growth. At present, the TSI is not signaling a slowdown in growth leading to recession coming in the 4-6-month timeframe (Chart 2).

Are We There Yet?
The first issue to examine is whether the much-discussed slowdown in U.S. GDP growth is demand-driven. Freight transport data provides insight into this issue. Trucking conditions have cooled, but only to the extent that they went from red hot to very strong. During prior growth cycles, trucking conditions have generally peaked well before growth began to decelerate (Chart 3). CEO confidence has shifted over time from being a leading indicator to a lagging indicator of business investment, but the two measures continue to move together. Both measures are currently elevated (Chart 4) and show no signs of a collapse of business conditions.

Splitting freight conditions into volume and pricing provides an indication that the slowdown in freight transport growth is driven by capacity rather than demand. Growth of shipments ground to a halt at the start of 2019, but the growth of freight spending remains strong (Chart 5). Producers are having to pay up to pass through the bottleneck to get their goods to market. Another interesting indicator of binding capacity constraint is the reversal of the old rule of thumb in the freight sector that volume leads pricing. Chart 6 below shows that in 2013 and 2017 the reverse was true. Signs of increased demand for freight capacity were immediately met with freight rate increases.

Using transportation data also requires an understanding of what is being put on the trucks, trains and planes. During the mid-2000s the long-distance trucking and construction industries were tied at the hip (Chart 7). However, in the aftermath of the Great Recession, the marginal driver of freight traffic has been the manufacturing sector (Chart 8). The slowdowns in manufacturing employment growth in 2012-2013 and 2015-2016 were matched by slowdowns in long-distance trucking employment growth. In contrast, employment growth in the construction sector hardly slowed.

Economic Conditions
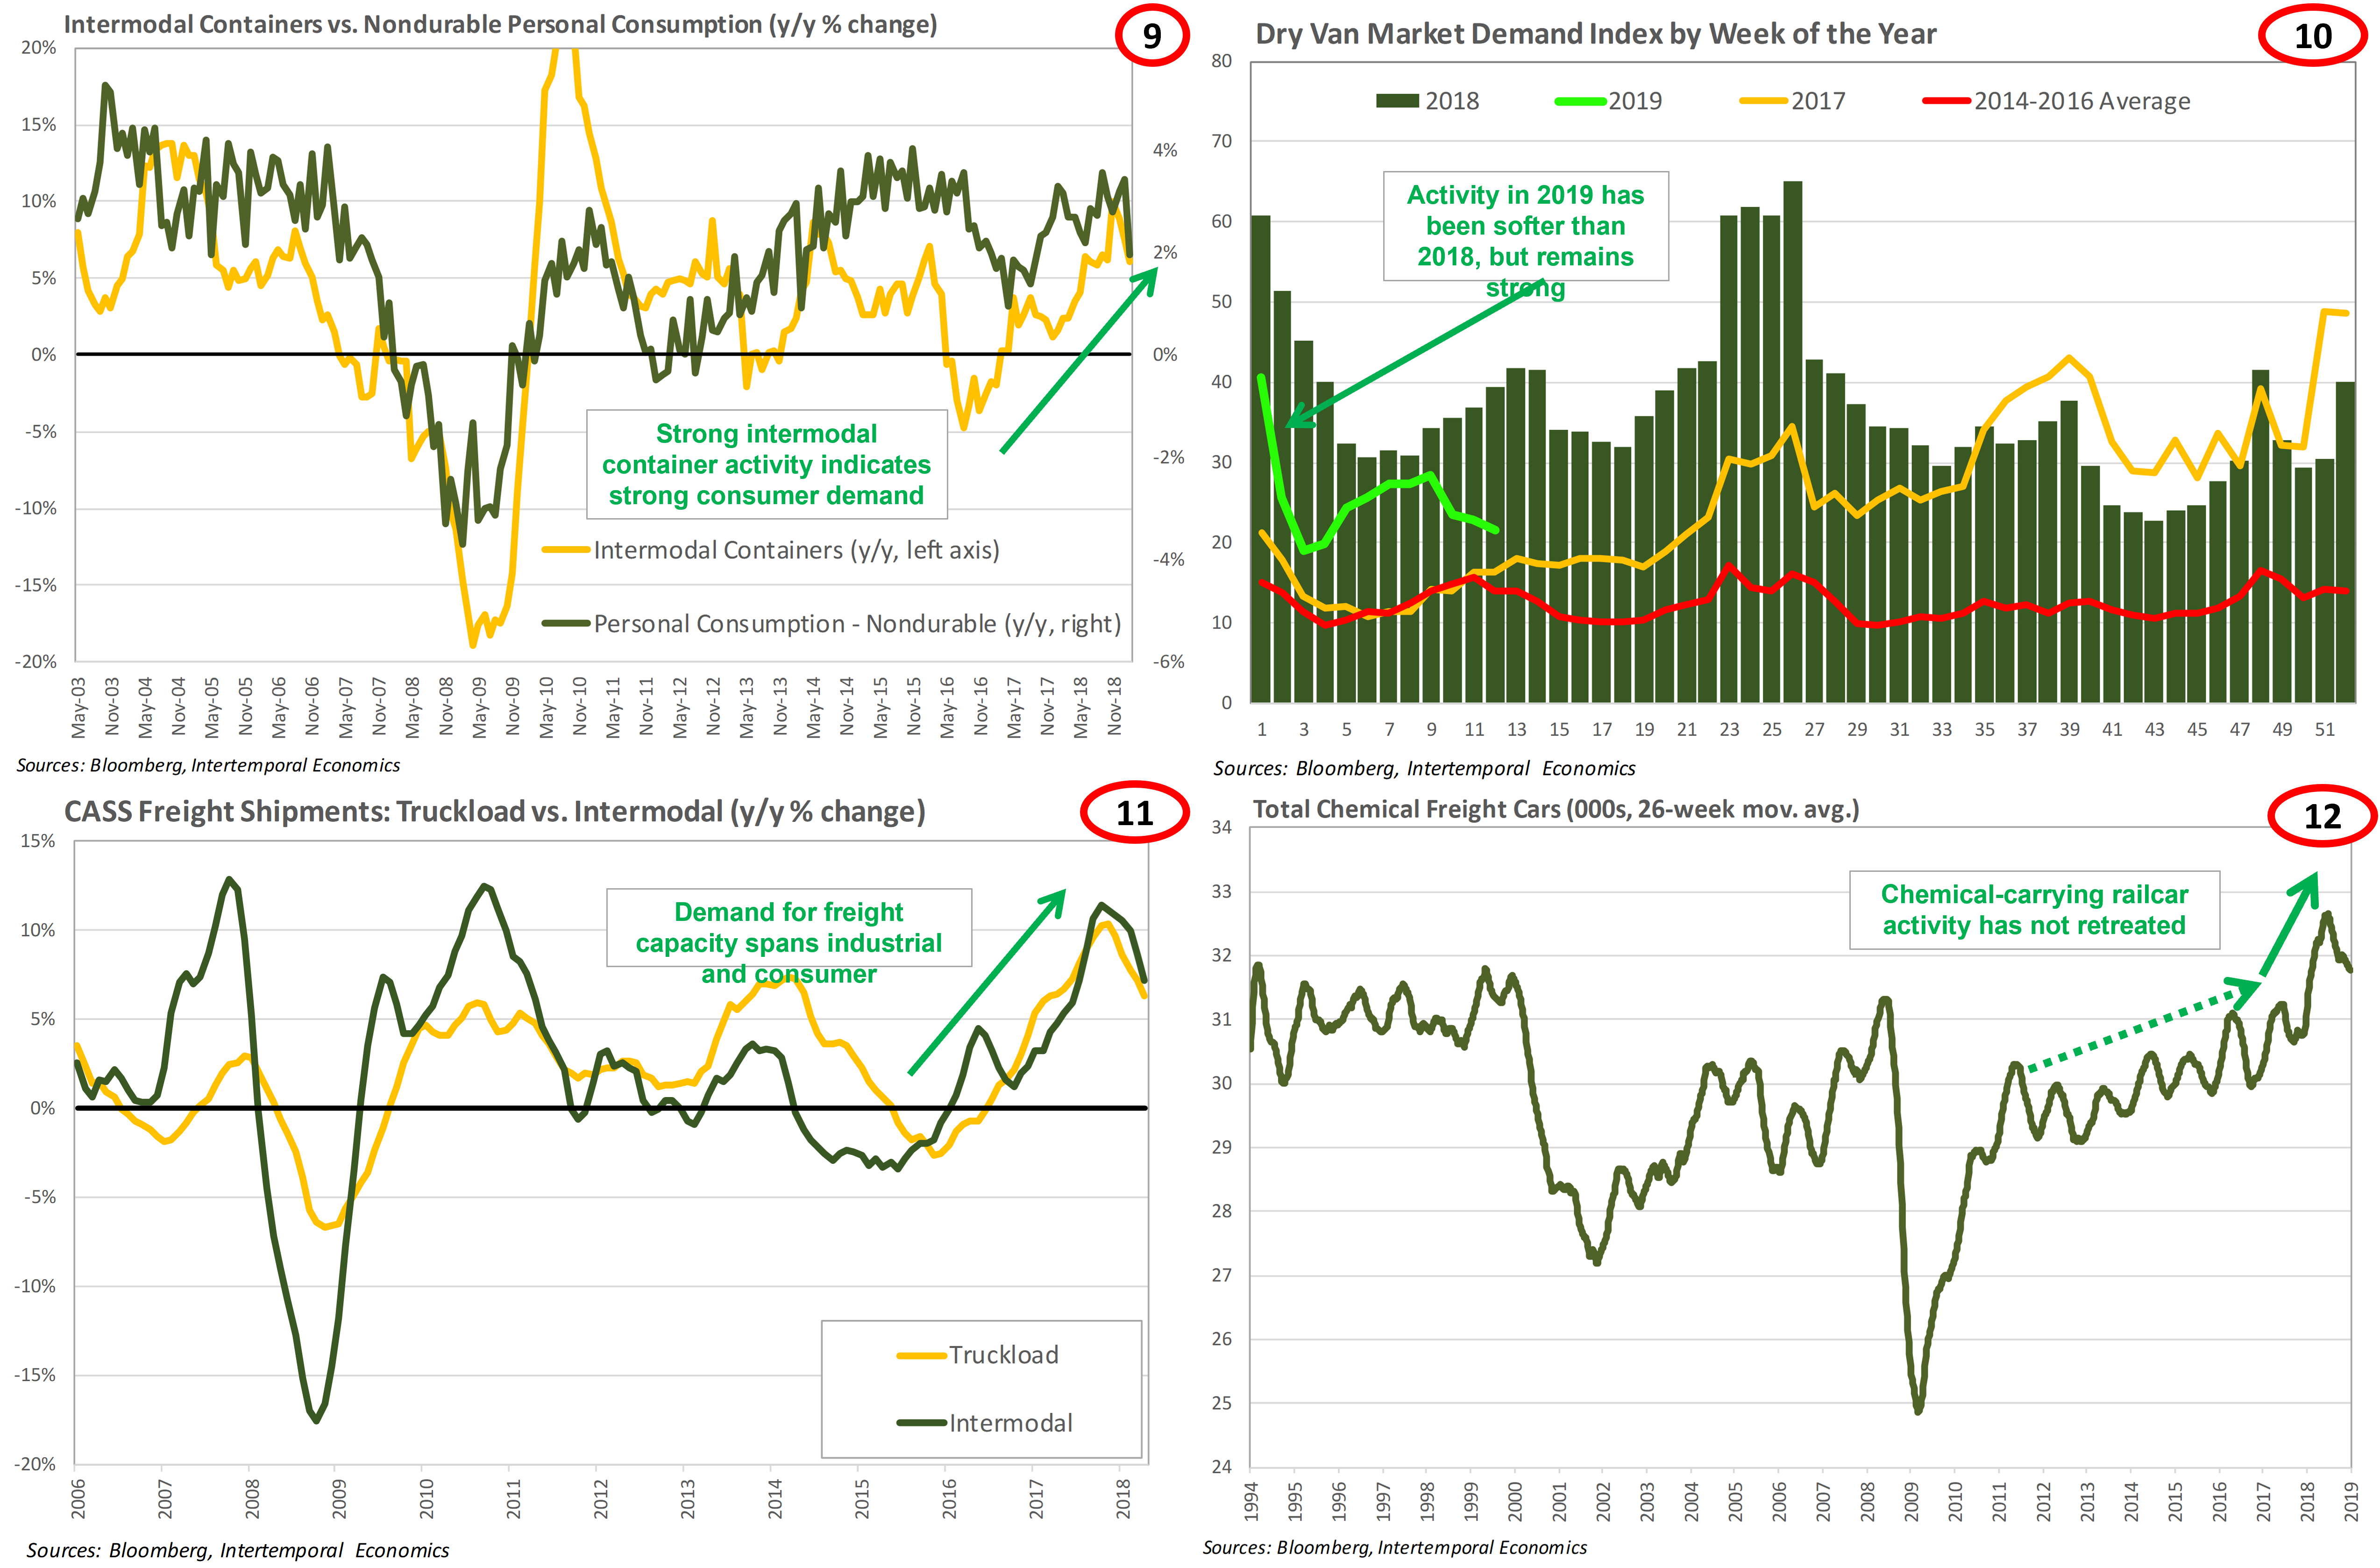
Looking forward, conditions in the transportation sector point to continued strength in demand even if GDP growth is limited by capacity constraints. Intermodal container and “dry van” shipments are both good leading indicators of consumer demand. Chart 9 shows there is no sign of an imminent collapse in demand from the intermodal container count. Demand for cargo trailers (i.e. “dry vans”) to move boxes of consumer goods has cooled since early 2018 but remains much stronger than demand observed from 2014 through mid-2017 (Chart 10).
Indicators of industrial demand in the US also remain strong. ‘Truckload’ shipments, which are generally industrial goods, have shown strength on par with intermodal shipments and growth sits near post-recession highs (Chart 11). Bulk chemicals are generally shipped by rail and provide an important forward indicator of industrial production. To make almost anything in industrial volumes requires some sort of chemicals. Chemical shipments via rail have not retreated from the 2018 jump in activity (Chart 12).
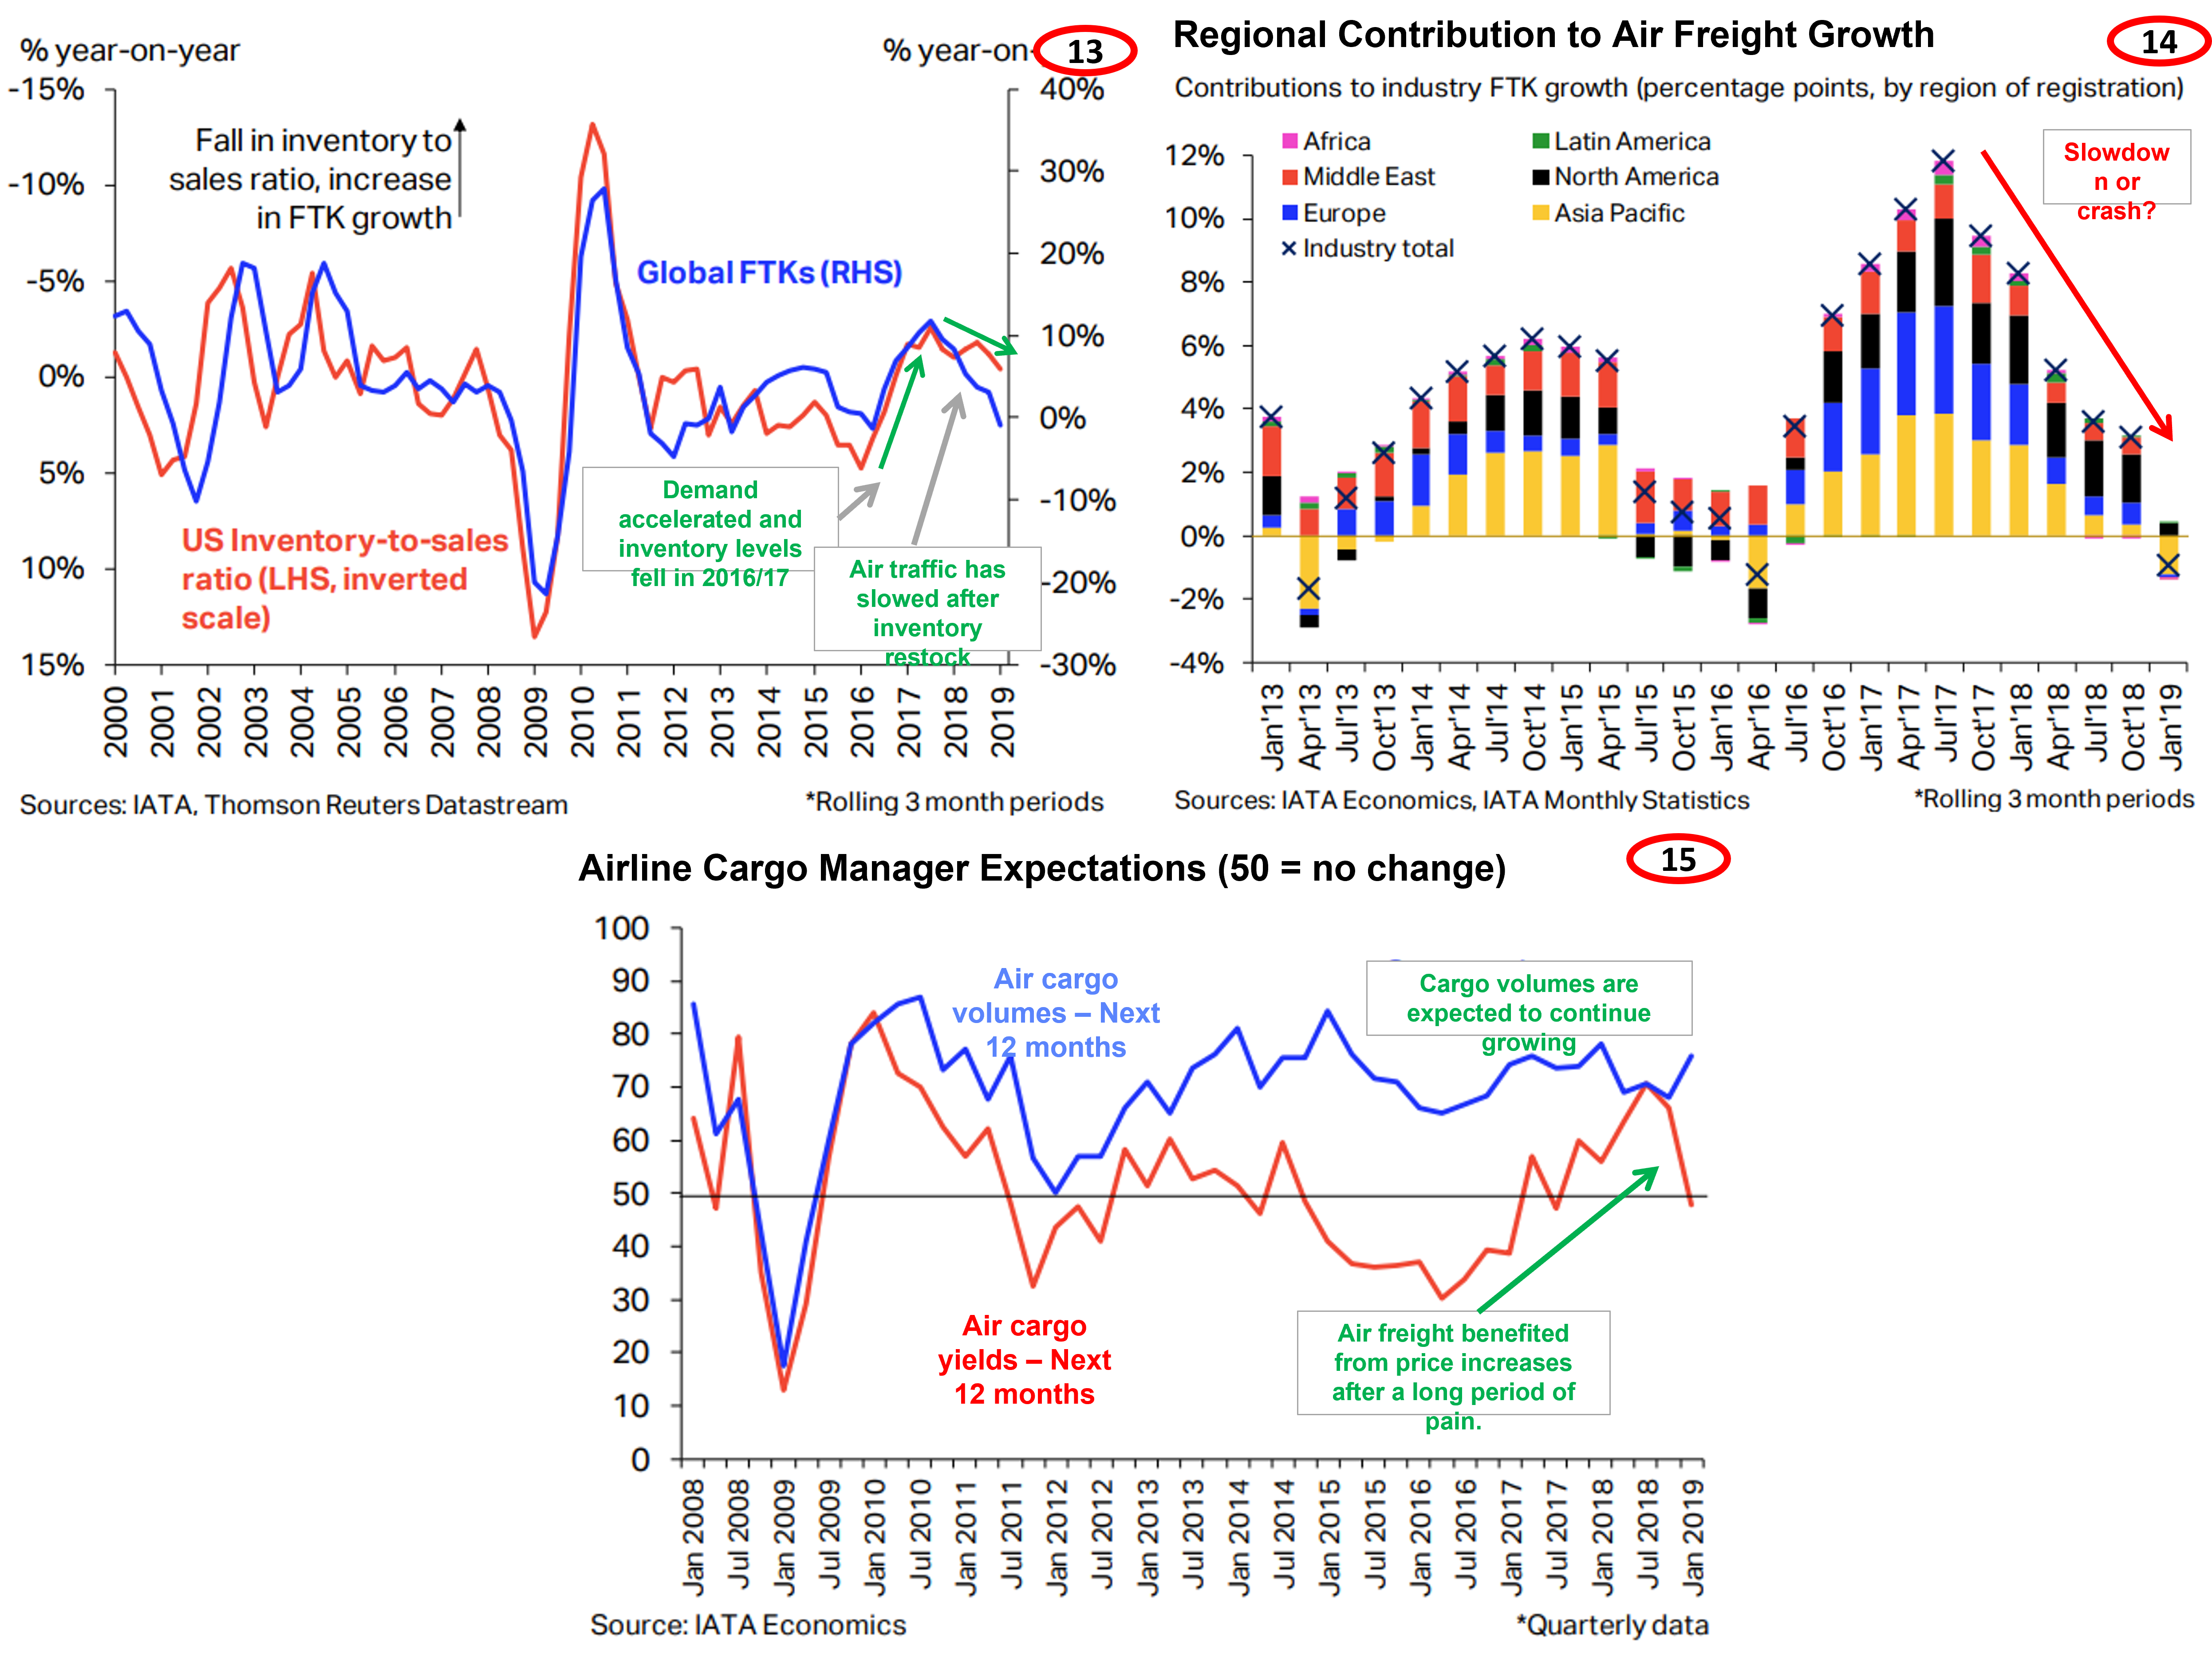
Global freight transport activity has also cooled. Air freight activity provides insight into rapid changes in business expectations that causes businesses to adjust their inventory-to-sales ratio (up or down). Air freight traffic is 87% international and is the quickest, but most expensive, method of moving freight. The deceleration of air freight growth in late 2018 was related to the end of a global inventory re-stocking and did not come out of nowhere. However, the slowdown the first quarter did catch many by surprise and raised the specter of global recession (Chart 13). I would argue that the drop-off in North American activity in January 2019 was the result of the federal government shut down and that activity will rebound (Chart 14). The slowdown in Asia-Pacific has been particularly sharp and should raise concerns about global growth. However, since 30% of imports to the US from China are sent by air, the effects of tariffs and restrictions on microprocessor sales have had a major effect on this sector. However, if the US and China come to a trade agreement and/or the Chinese government engages in fiscal or monetary easing, then activity in that region could rebound quickly. Indeed, airline cargo executives expect shipment volumes to remain strong in 2019, their main concern is a drop-in cargo yields due to rising input prices (Chart 15).
Capacity Issues
As mentioned above, in the face of capacity constraints additional demand cannot push growth above trend for very long. The result is a slowdown of economic growth and an acceleration in price growth. The modern economy is very good at shifting resources to work around bottlenecks, but there are only so many trucks, trains and planes. As discussed in my note on the freight trucking sector[1], the binding capacity limit of the trucking sector are clearly visible when prices and volumes are plotted against each other (Chart 16). The chart also provides a nice example of how a slowdown must fall below the original level of activity to return prices to pre-boom levels.
Capacity constraints in the trucking sector have become such that the entire supply chain is feeling the weight of holding extra inventory waiting for shipment. Warehousing costs are rising in step with shipping costs (Chart 17). Consumers have been shielded from capacity-driven price increases by businesses accepting lower profit margins, but that can only go on for so long. A slowdown in growth will not be enough to ease transport capacity constraints unless capacity is able grow faster than trend growth for the overall economy.

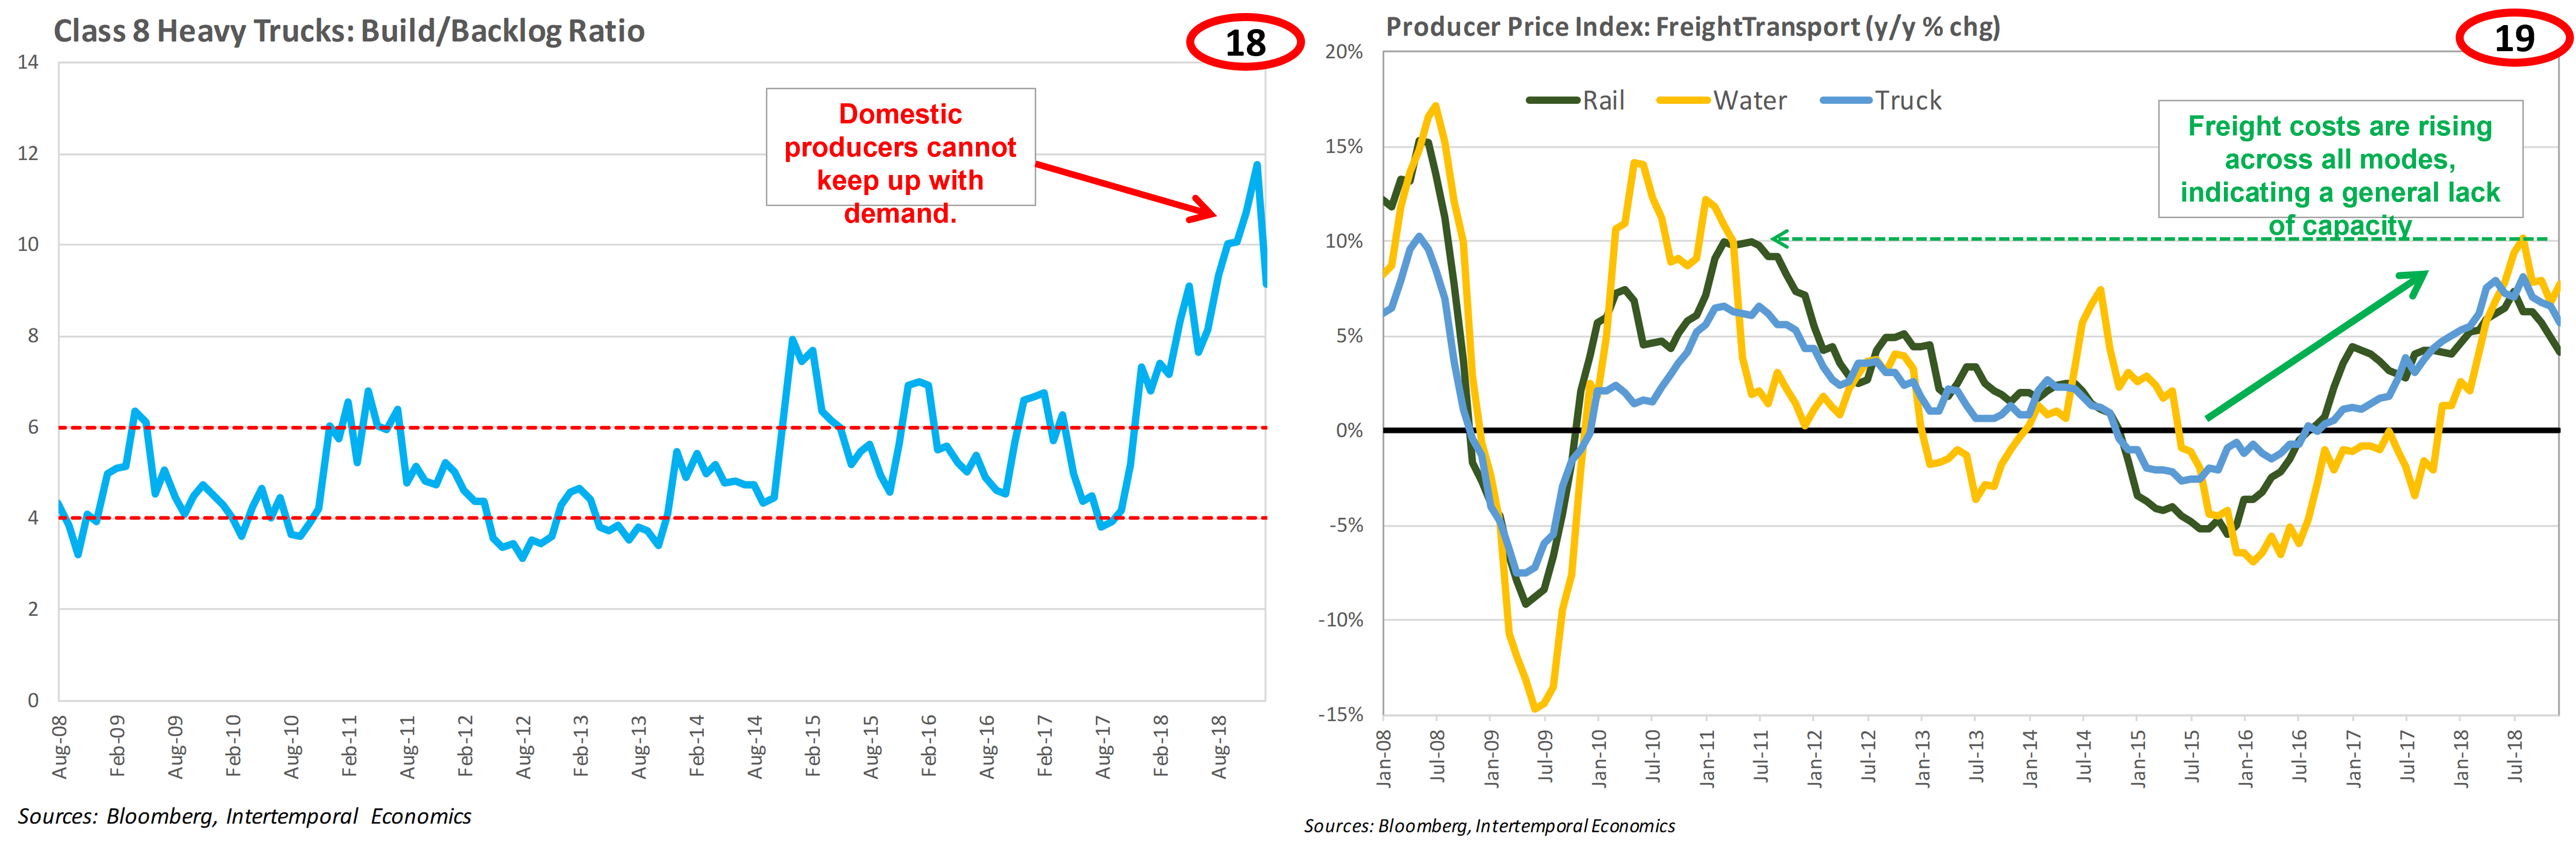
Unfortunately, prospects for rapid capacity growth do not look good. New orders for heavy trucks surged in 2018 and the truck manufacturing sector has not been able to keep up (Chart 18). Some of the backlog is due to the sudden rise in orders, but some is also due to shortages of key components made outside the US. If trade tensions increase further – particularly with Europe – the trucking sector’s ability to add capacity will be seriously curtailed, even at trend growth. Bulk transport methods have some degree of substitutability and the current environment is no exception. But there is simply no way to get around the binding constraint on economic growth caused by a shortage of freight transport capacity (Chart 19).
Conclusion
Analysts are incentivized to use the first sign of a growth slowdown (i.e. the second derivative) as a signal for an oncoming recession. This strategy works well enough if you know the trend rate of potential GDP growth and the trend is stable. Given the overprediction of recession warnings, it is clear the current strategy is better at spotting changes in the rate of growth than predicting a switch from expansion to contraction. A better strategy is to incorporate the third derivative by using freight transportation and warehousing data. This high-frequency data is also high-quality because it is based on actual counts rather than statistical inferences. This data provides insight into the reasons for changes in the pace of growth and therefore provides insight into whether that change will revert to trend or continue.
In this note, I have argued that the slowdown in Q1 was the result of capacity limits and, for international freight, the completion of a global inventory restocking. The argument implies inflationary pressure will not recede as economic growth slows back to a reduced potential growth rate. Of course, as has been frequently pointed out by FOMC members, inflation expectations are the pillar that US monetary policy currently rests on. Inventory pressures continue building based on the ISM’s Purchasing Manager Index, indicating inflationary pressures will continue to build (Chart 20). Thus far, gasoline prices have been a blessing for the FOMC. The crash in gasoline prices in 2014 pushed down long-term inflation expectations by one-half a percentage point and they have only rebounded by 0.1 percentage point since early 2017 (Chart 21). If inflation expectations remain subdued, the FOMC has room to “pause” and wait to see what happens. However, the fact that consumer prices as measured are not rising as fast as desired, does not mean that inflationary pressures are not lurking. Market participants should keep a close eye on freight transport activity for signs of changes in the pace of growth and the reasons behind the changes. In addition, watch for the FOMC to react strongly to a rapid increase in inflation expectations.
[1] See my note “Trucking, Bottlenecks and Inflation” of 2 August 2018.
Go on, geek out on the TSI:
https://data.bts.gov/stories/s/9czv-tjte#freight-transportation's-relationship-to-the-economy
https://www.bts.gov/archive/publications/special_reports_and_issue_briefs/special_report/2014_12_10/entire
The first link is kind of cool since it uses relevant/current data with a handy review of the concepts so you can freshen up when you visit every month or two. Of course, using the GDPNow, CFNAI, ANFCI, etc and their sub-indexes are what I suppose most of us already overloaded defined contribution drudges use to keep an eye on this sort of stuff, but, if that wasn't enough, then take off with this:
https://www.iata.org/en/publications/economics/?Search=&EconomicsL1=149&EconomicsL2=150#searchForm
https://www.iata.org/en/iata-repository/publications/economic-reports/air-freight-monthly-analysis---april-2022/
The recent air-freight data is definitely gliding down, but, reasons are a tangled up mess, which if it were just limited to any single problem, it wouldn't seem like there would be much to worry about. But the sheer multitude of global problems added together suggests unanticipated emergent risks/events are likely. Something like an untrained crew of half-crocked potato farmers being put in charge of an air-defense missile system comes to mind.
Watched a Stanley Druckenmiller interview video the other day and one of the ways he said he peers into the future (he seemed to be interested primarily with about a 1 year time frame, presume it is probably about the LTCGs, it is for me ...) is digging through Trucking and Homebuilder company data. Doubtless he has minions for that now days.