

The Underpinnings of a Nonlinear Phillips Curve
The Underpinnings of a Nonlinear Phillips Curve
Mirror, mirror, on the wall...

This note was sent to Premium Plus subscribers on September 25, 2018. I am distributing it here on Substack to provide background context for my ongoing work on the labor market.
· While the Fed is focused on searching for r* (i.e. the neutral rate), a short-tenor rate, long-tenor rates will rise above the Hayekian natural rate triggering a capital liquidation. The catalyst will be bond market participants being surprised by a sudden surge in wages and/or prices.
· That will cause the entire yield curve to move upwards while becoming inverted (or more inverted) as market participants anticipate (incorrectly) a robust tightening in the short-run and a higher neutral rate in the long-run.
· The debate over nonlinearity is strange because nonlinear price curves are quite common in the real world. Anytime you have an input to production that is highly complementary and has very limited substitutability there is the potential for a bottleneck and the associated nonlinear price curve.
… which is the scarcest factor of production of them all?
Detractors of the Phillips curve argue it lacks theoretical underpinnings and that empirical evidence cannot stand on its own (Chart 1). If you define “theoretical underpinnings” as a statistically sound equation, then you will side with the detractors. I do not think that difficulties in statistical modelling disqualify an economic concept from consideration, especially when empirical observations line up with first principles.
Putting theory aside, empirical findings in the existing research on the Phillips curve have been mixed largely because of an insistence on using statistics as the lingua franca of economics. Phillips’ original paper assumed that the relationship was non-linear. However, in the 1970s & 1980s economists chose to use linear specifications for mathematical convenience and the habit stuck. As a result, for sixty years economists have had limited success because they have been studying a nonlinear relationship using a linear toolkit. By assuming a linear model and ignoring the factors that drive accelerating inflation, market participants and the FOMC risk being surprised by a sudden acceleration of wages and/or inflation.
Nonlinear Price Curves Abound in the Real World
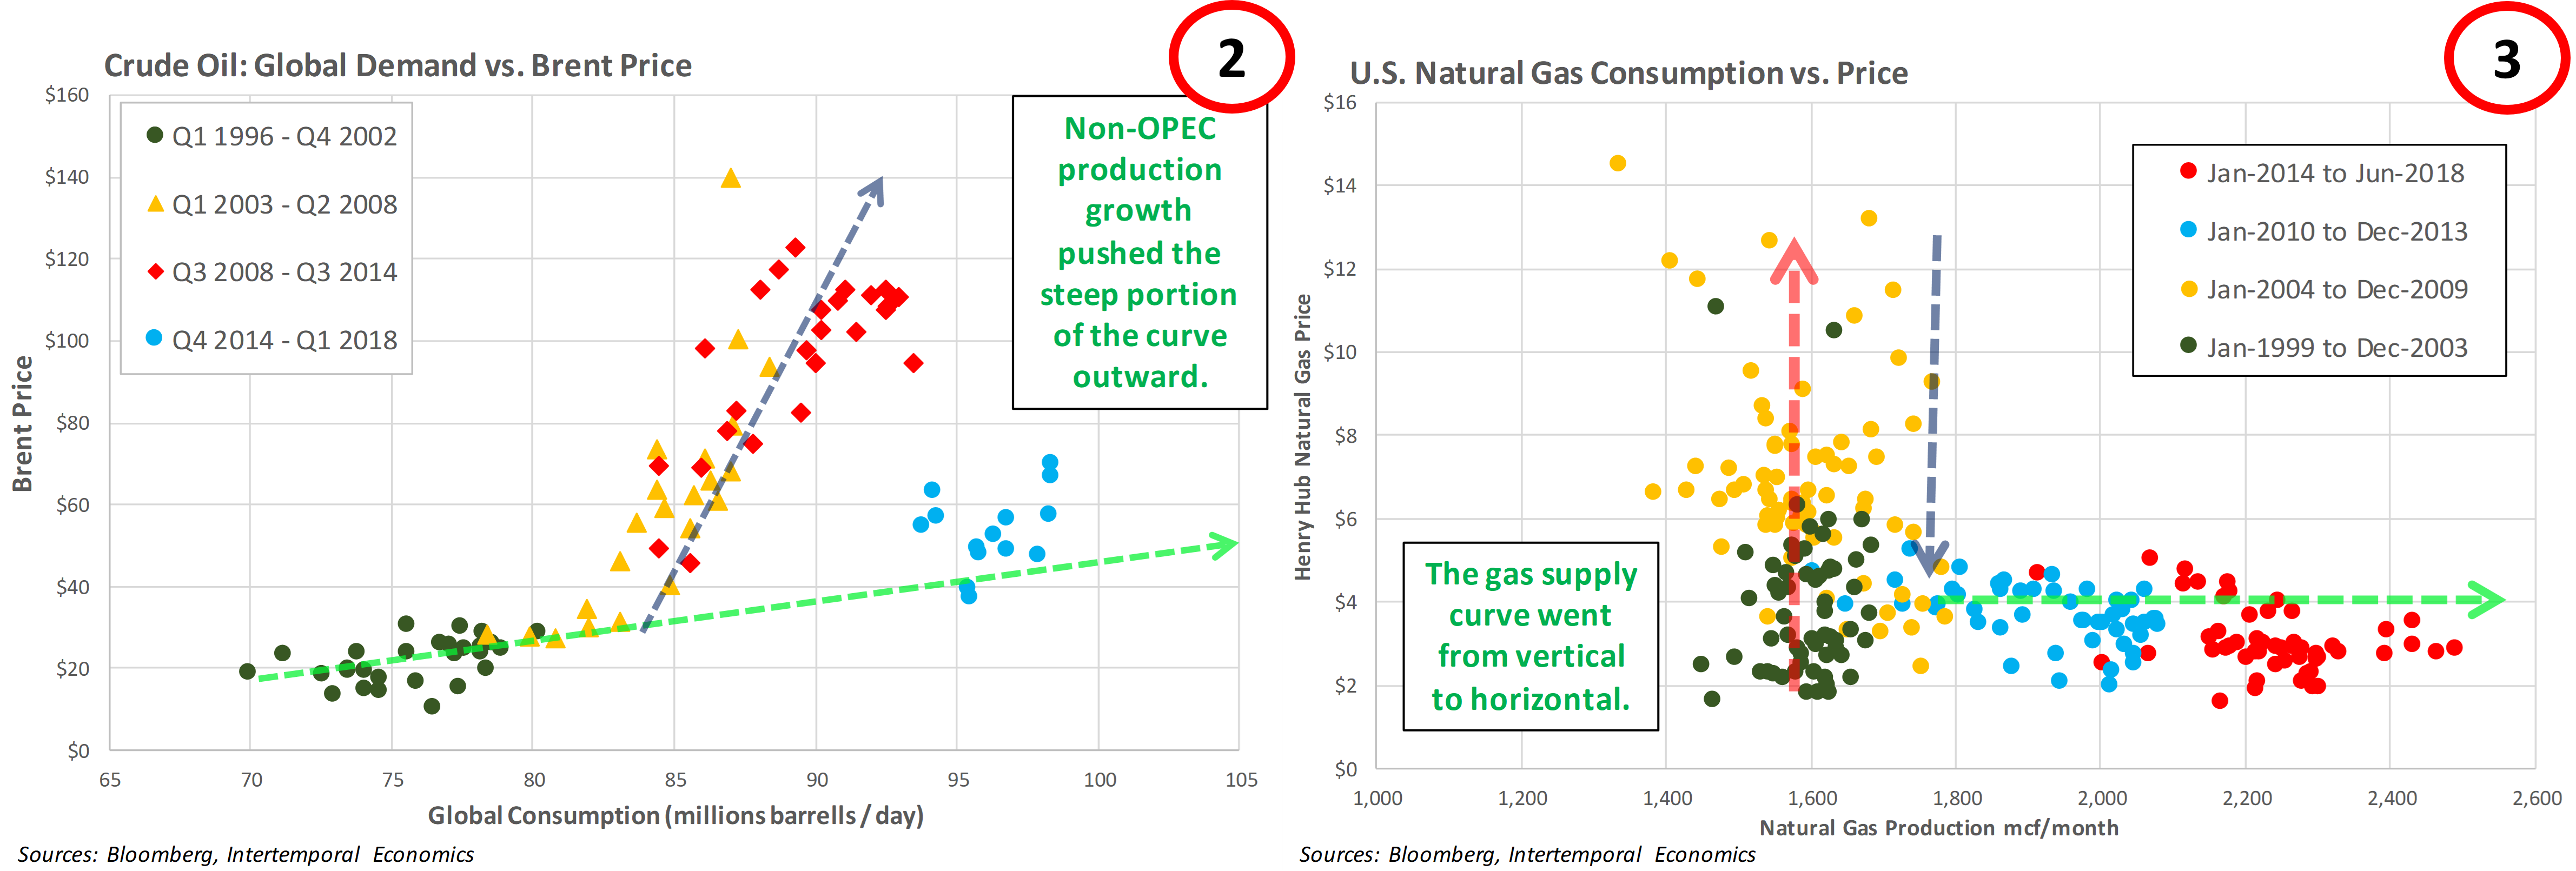
The debate over nonlinearity is strange because nonlinear price curves are quite common in the real world. Anytime you have an input to production that is highly complementary and has very limited substitutability there is the potential for a bottleneck. The most obvious inputs that meet these requirements are energy-related products. Charts 2 and 3 below show the clear nonlinear price profile of crude oil and natural gas, respectively.
Chart 2 shows global crude oil demand matched up with the price of Brent crude. The steep price increases of the mid-2000s collapsed as non-OPEC production expanded capacity, moving the steep portion of the supply curve to the right.
Due to transportability limitations natural gas generally exhibits a vertical price structure because supply is inelastic, and demand sets the price. Chart 3 below shows that because of fracking, the U.S. natural gas price curve has gone from vertical to horizontal as the capacity constraint has yet to be found. With the growth of a global LNG market the supply curve for natural gas will likely look more like that of oil because the U.S. can tap into the global LNG supply if it ever reaches capacity again.
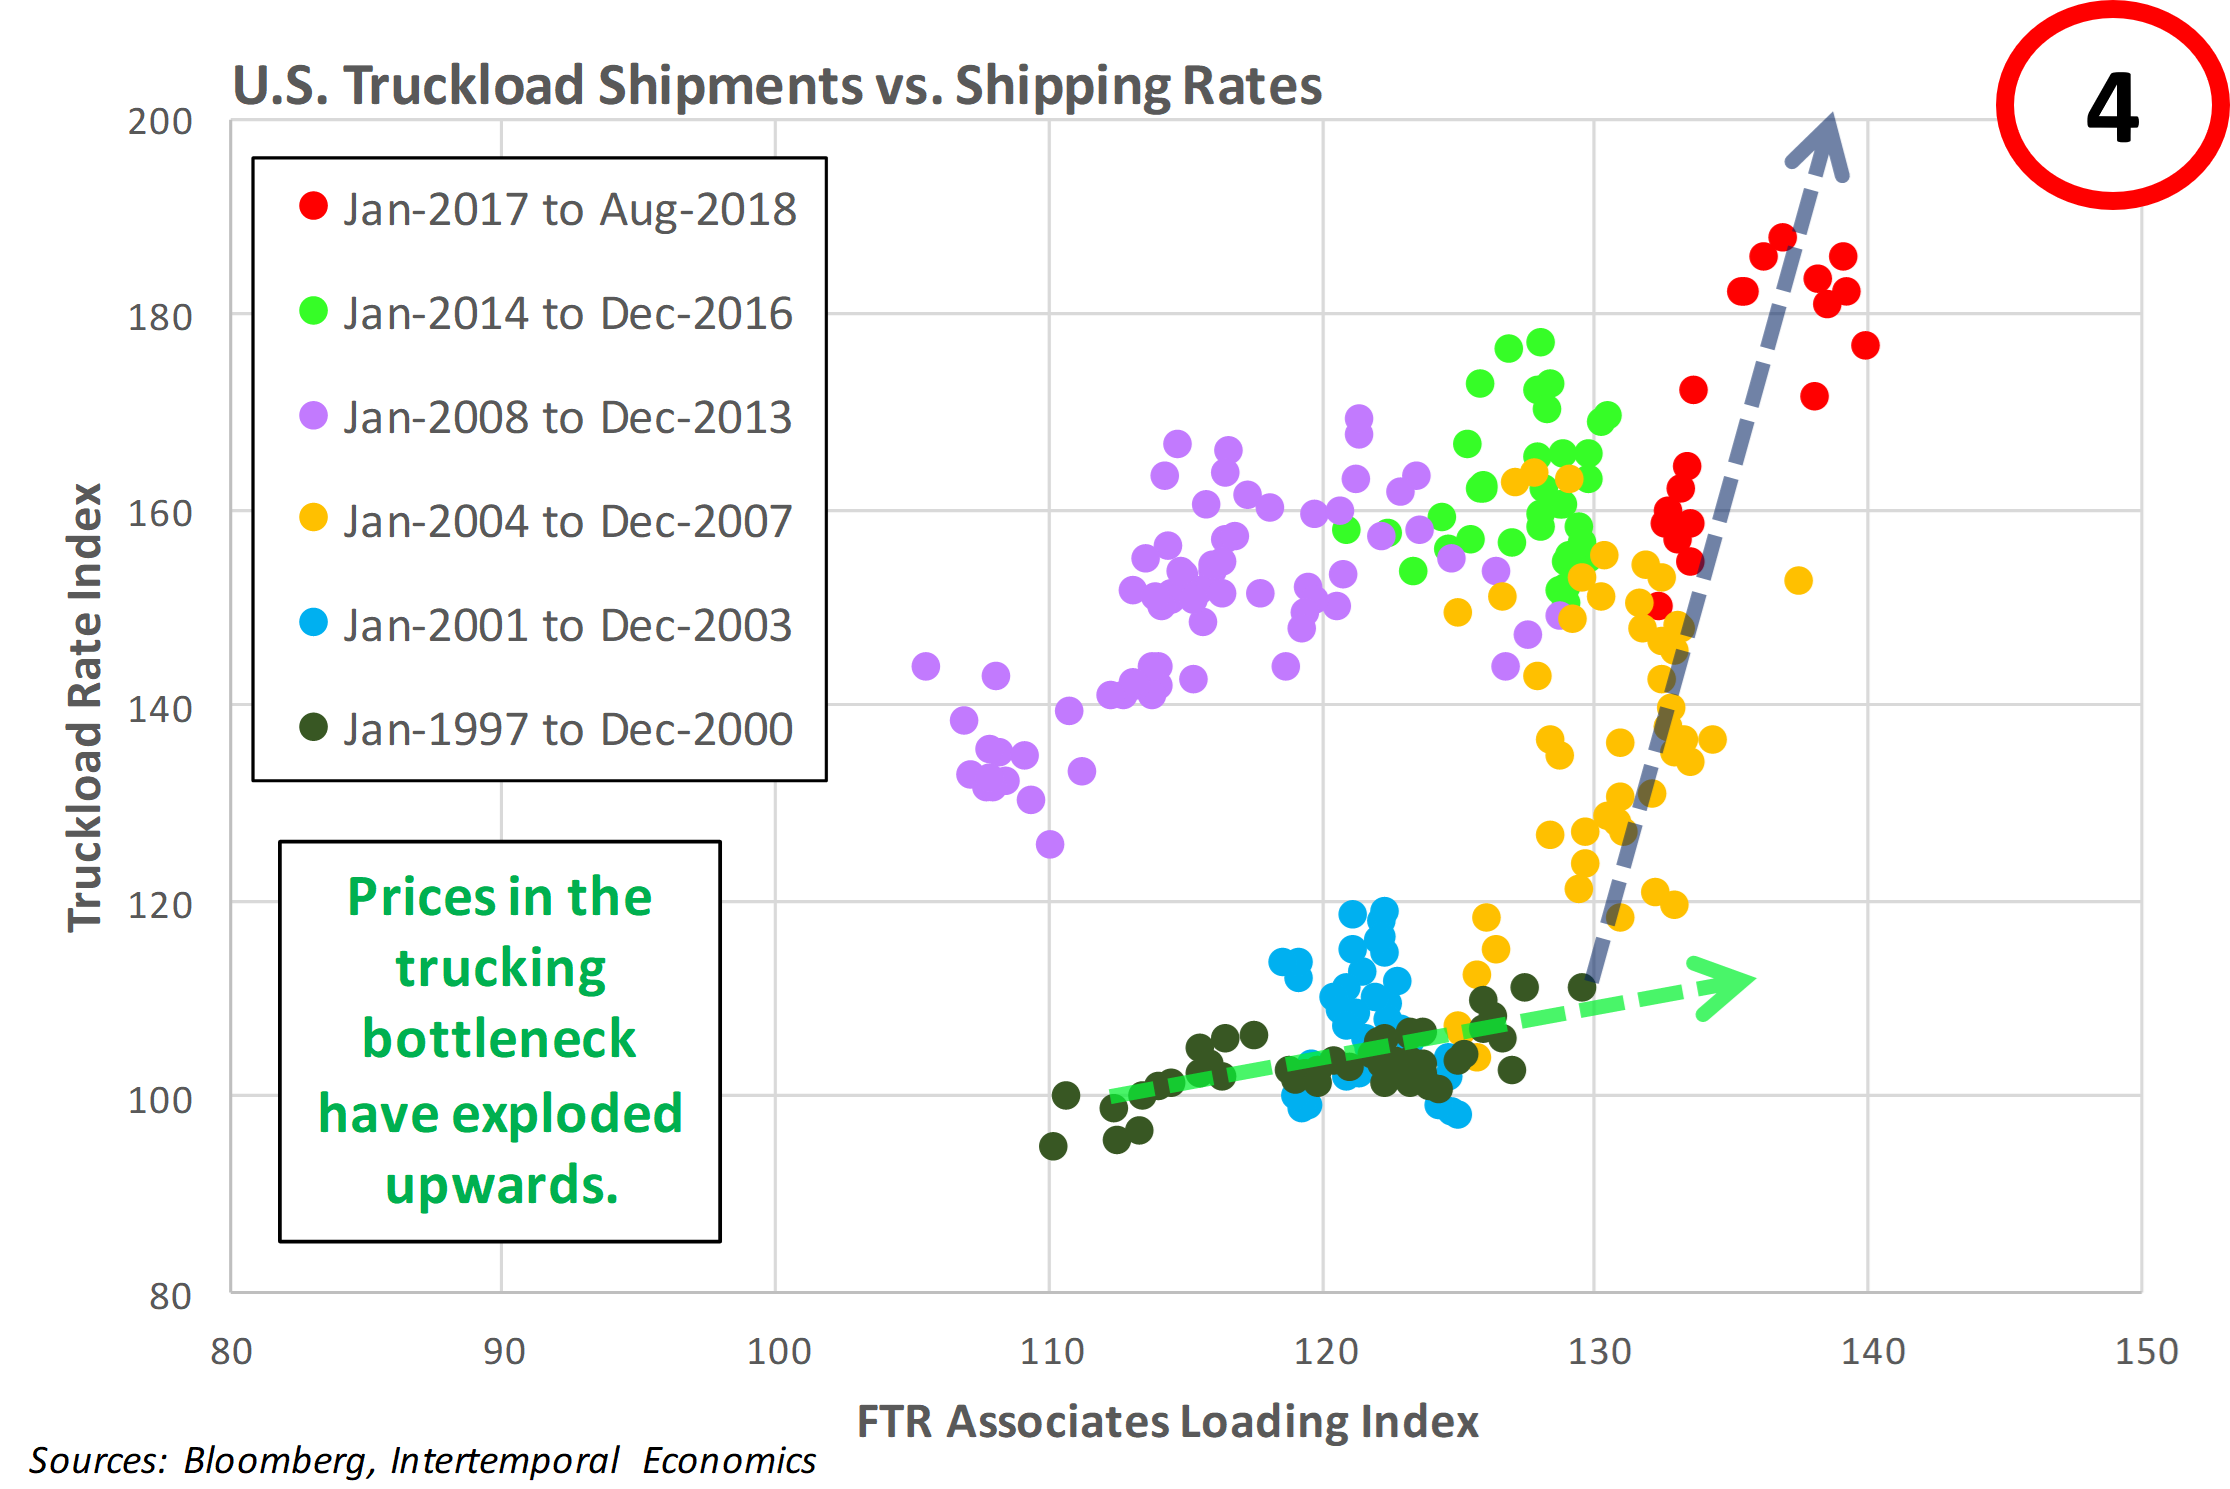
As discussed in a recent note[1], due to a shortage of drivers and tractors the trucking industry is currently a major bottleneck in the U.S. economy. The same nonlinear curve shows up in trucking as in the two energy commodity examples and, not coincidentally, looks like the wage-Phillips curve shown above.
Theoretical Underpinnings
In my opinion, Mises laid out the theoretical underpinnings for a nonlinear wage-Phillips curve in his seminal work, Human Action. Mises argues that it is a mistake to treat labor as different from other inputs to production. Labor is a necessary input to all forms of production just as energy is a necessary input for most production. As stated by Mises:
“The unique position which labor occupies in our world is due to its nonspecific character…human labor is both suitable and indispensable for the performance of all thinkable processes and modes of production.”
“Complimentary factors of production can only be used to the extent made possible by the availability of the most scarce among them… In our world there is no abundance, but a shortage of manpower, and there are unused material factors of production, i.e., land, mineral deposits, and even plants and equipment.”
If capacity constraints limit the ability of firms to meet cyclical increases in demand, then the short-run relationship between output and inflation will have a curved shape. Economic expansion is limited in the short run by capacity constraints that act as a stretchable ceiling rather than a wall. Capacity can be stretched only so far without upward price pressure building. That means inflation is more sensitive when activity is high than when it is low.
Modelling Issues
The primary problem econometricians face when modeling the price-Phillips curve is that any measure of excess demand will be error-prone because potential output is unobservable. These errors make it difficult to draw inferences about the effects of excess demand on other variables. Mismeasurement of potential output biases downward the explanatory power of excess demand.
Economists can observe shocks to output, but they cannot tell in real time whether the change in output is caused by a supply shock (usually persistent), a demand shock (usually temporary) or a combination of the two. Since these factors can change simultaneously there is no way to track the output gap quarter-to-quarter. Without a reliable measurement of the output gap there is no way to model a nonlinear relationship where the sensitivity of inflation to output rises as output rises. In contrast, if the curve is assumed to be linear you only need to find the slope of the line once.
A second, more basic issue is that there are so few complete economic cycles from which to draw data and the cycles follow an asymmetrical pattern. Brief stints of massive excess supply followed by longer “recovery” periods. As a result, the distribution of excess demand conditions is not random or normally distributed.
Implications
A convex Phillips curve gives a rationale for fighting inflation aggressively during periods of overheating. Gains in output during inflationary periods are lower than the costs of bringing inflation back down. To avoid inflation trending upwards, the sum of negative output gaps over time must be larger than the positive output gaps. Otherwise, inflation will rise with each cycle because positive output gaps raise inflation more than negative output gaps reduce it. However, if variability of output is reduced average output will be higher. That implies monetary policy should lean against shocks that push the economy away from potential. Maintaining stable inflation also stabilizes output relative to potential. That means average output will be higher. The terminology for output without fluctuations is y*.
The central bank must balance running the risk of overheating by waiting to raise rates against the risk of acting too early and ending the expansion. Aggregate demand responds to changes in monetary conditions with a lag and inflation responds to demand with a further lag so once inflation gains momentum it will take time to stop. In the presence of a nonlinear Phillips curve, waiting carries an additional cost. If the central bank waits, output will rapidly rise further above potential and need to be brought even further below potential to return inflation to target. Waiting not only exacerbates the cycle, it also lowers average output.
Stabilizing inflation => lean against output gap => reduce output volatility = higher average output.
Conclusion
What does this mean for monetary policy? The output costs of reducing inflation depend on the speed of the path chosen by the monetary authority, expectations adaptation and the form of the Phillips curve. The adjustment speed of expectations is tied to how much effect monetary policy has on demand in the short run. If inflation gathers momentum and expectations for future inflation begin to change, returning expectations to target requires tightening policy more rapidly and to a higher degree than expected.
Will the Fed be forced into a choice between an inflation spiral or an extended period of robust tightening? I find that highly unlikely because while the Fed is focused on searching for r* (i.e. the neutral rate), a short-tenor rate, long-tenor rates will rise above the Hayekian natural rate triggering a capital liquidation.
The catalyst will be bond market participants being surprised by a sudden surge in wages and/or prices. That will cause the entire curve to move upwards while becoming inverted (or more inverted) as market participants anticipate (incorrectly) a robust tightening in the short-run and a higher neutral rate in the long-run.
The effect will be to trigger capital liquidations when long rates move above the rate of return on projects available for investment. At the same, yield curve inversion chokes off lending. The effect is the sudden stop “Minsky moment” that Americans have unfortunately come to view as a natural part of capitalism.
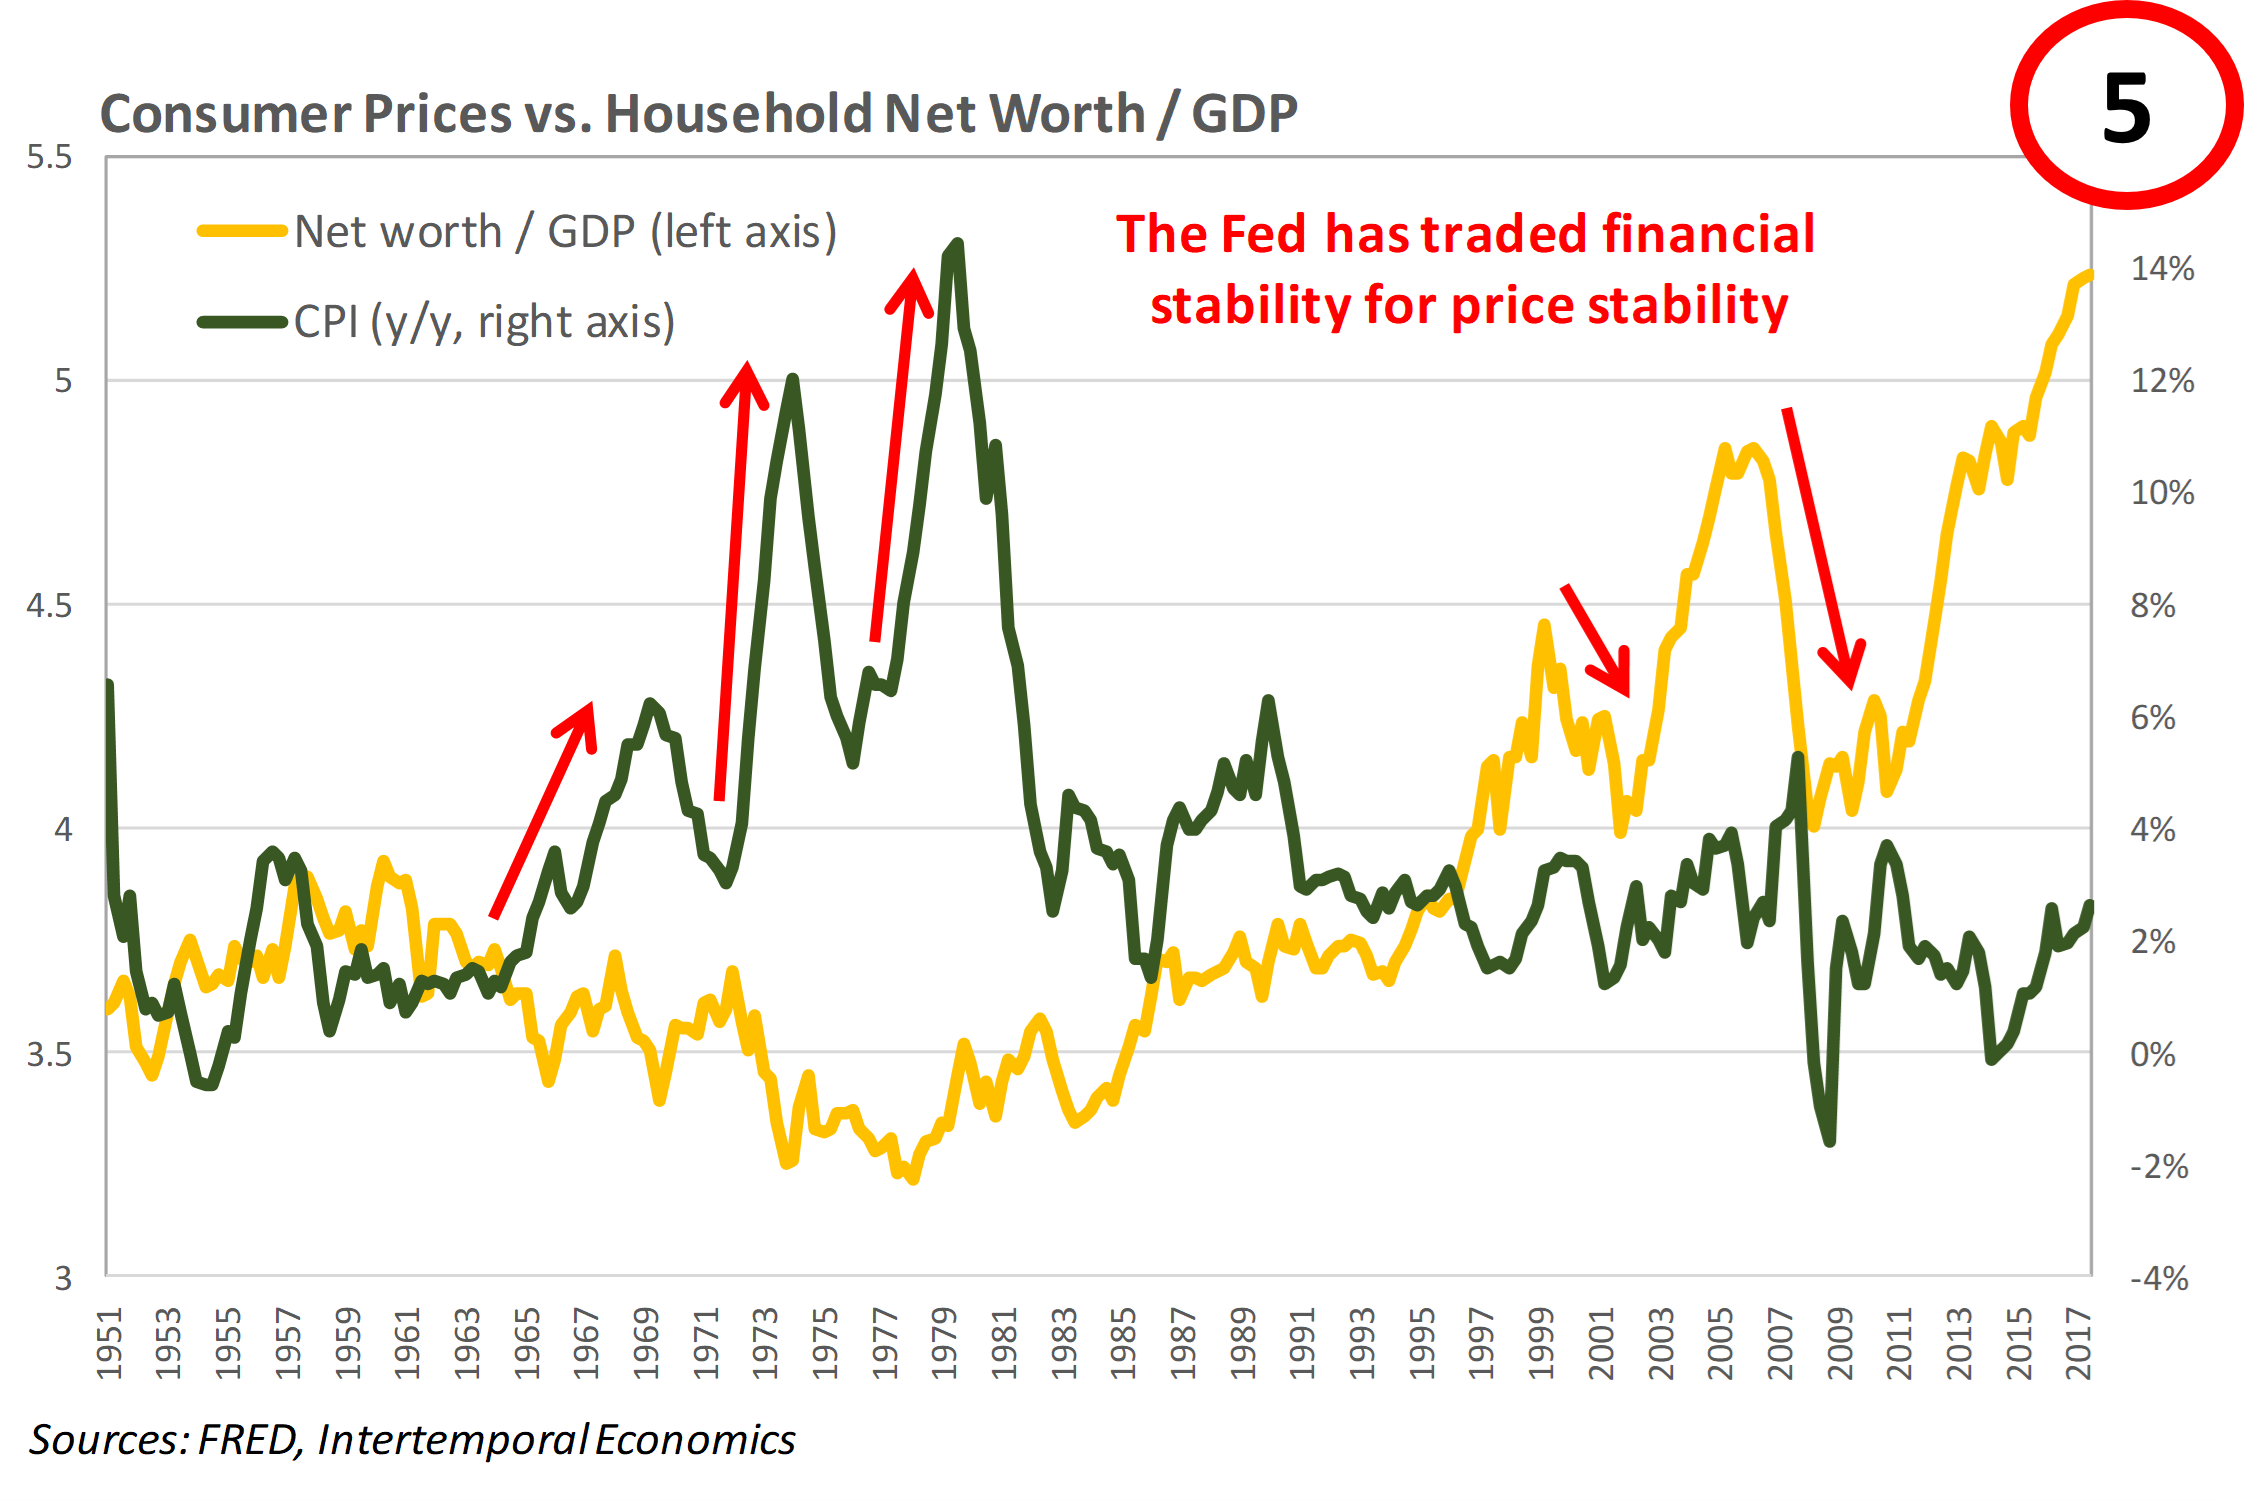
If this assertion sounds outlandish, consider that in the last 23 years the FOMC has shown twice that it is willing to trade financial stability for price stability (Chart 5). An analysis of Powell’s “reaction function” and the implications for economic activity will be the subject of my next note.
References
Laxton, Douglas, David Rose, and Robert Tetlow, 1993, Problems in Identifying Nonlinear Phillips Curves: Some Further Consequences of Mismeasuring Potential Output, Working Paper 93/6, (Ottawa: Bank of Canada), June.
Laxton, Douglas, David Rose, Robert Tetlow, 1993, Is the Canadian Phillips Curve Non-Linear?, Working Paper No. 93/7, (Ottawa: Bank of Canada), July.
Lein, Sarah M. and Kberl, Eva M., Capacity Utilisation, Constraints and Price Adjustments Under the Microscope (October 1, 2009). KOF Working papers / KOF Swiss Economic Institute, ETH Zurich No. 239, 2009.
Macklem, Tiff, 1997. "Capacity constraints, price adjustment, and monetary policy," Bank of Canada Review, Bank of Canada, vol. 1997(Spring), pages 39-56.
The views expressed or implied in this communication are those of the author and may not necessarily be the views held by Intertemporal Economics. The content of this message does not constitute, and should not be construed as, investment research or advice, and Intertemporal Economics expressly disclaims liability for any portfolio trading losses that may result from reliance on information or views expressed herein.
[1] See my note “Trucking Bottlenecks and Inflation”, of 2 August 2018.