


The Weekly Beat: 14 June 2022
The Weekly Beat: 14 June 2022
Mixed Signals, Oil Everywhere!, and Stocks to Watch

· The shockingly high CPI report released on Friday added further impetus to the equity market selloff that was in-progress and put further upward pressure on the front end of the yield curve. The back end of the curve, although higher than two months ago, remained fixed (Chart 1). As readers of the Weekly Beat know, the pressure on the yield curve to “pivot” is not new.
· The growing realization among investors that the potential growth rate of the U.S. is likely lower than it was pre-COVID is keeping a lid on long-term real interest rates. The refusal of the Federal Reserve to accept that the potential growth rate is lower is raising concerns that they will “chicken out” and not raise rates as aggressively as needed in the near-term, necessitating higher rates in the medium-term.
· The effect is that the yield curve has been “broken” into a monetary policy expectations component, and an asset purchase component. Evidence of this breakage can be found in the divergence in the maturity spreads of the front and back portions of the curve. In a highly unusual situation, the front end of the curve has become very steep while the back end of the curve has become very flat (Chart 2).
· The area of the curve where the two policies meet, in the two- to five-year maturity range, has experienced significant volatility and I expect this to continue (Charts 3 & 4). The debate over whether the pace of rate increases can catch up to bond yields will drive volatility. There is a gap between how fast policy rates can realistically rise and the current two-year rate. Arbitrage pressure will pull bond yields down to policy rates, requiring the Fed to prop them up unless it wants financial easing.
· We know the pressure to pivot is driven by real economic factors because it is playing out in the real interest rate market, rather than the fickler market for inflation expectations (Charts 5 & 6). That means the pressure for the yield curve to invert is strong and the Fed will need to fight the “pivot” to prevent inversion and forestall a recession. Once again, the situation for the Fed appears to be the worst in the middle of the curve, right at the five-year maturity (Charts 7 & 8). I expect the Fed will try to shape the curve with an Operation Untwist, but eventually Yield Curve Control will become the expedient option.
· The problem for the Fed is that the flattening of the long end of the curve tightened conditions in the market for investable funds while the steepening of the curve loosened conditions in the market for consumer borrowing. Inflationary pressure in the form of consumption via a lower savings rate has been the result, without the benefit of productivity-enhancing investment cut off by a decline in lending.
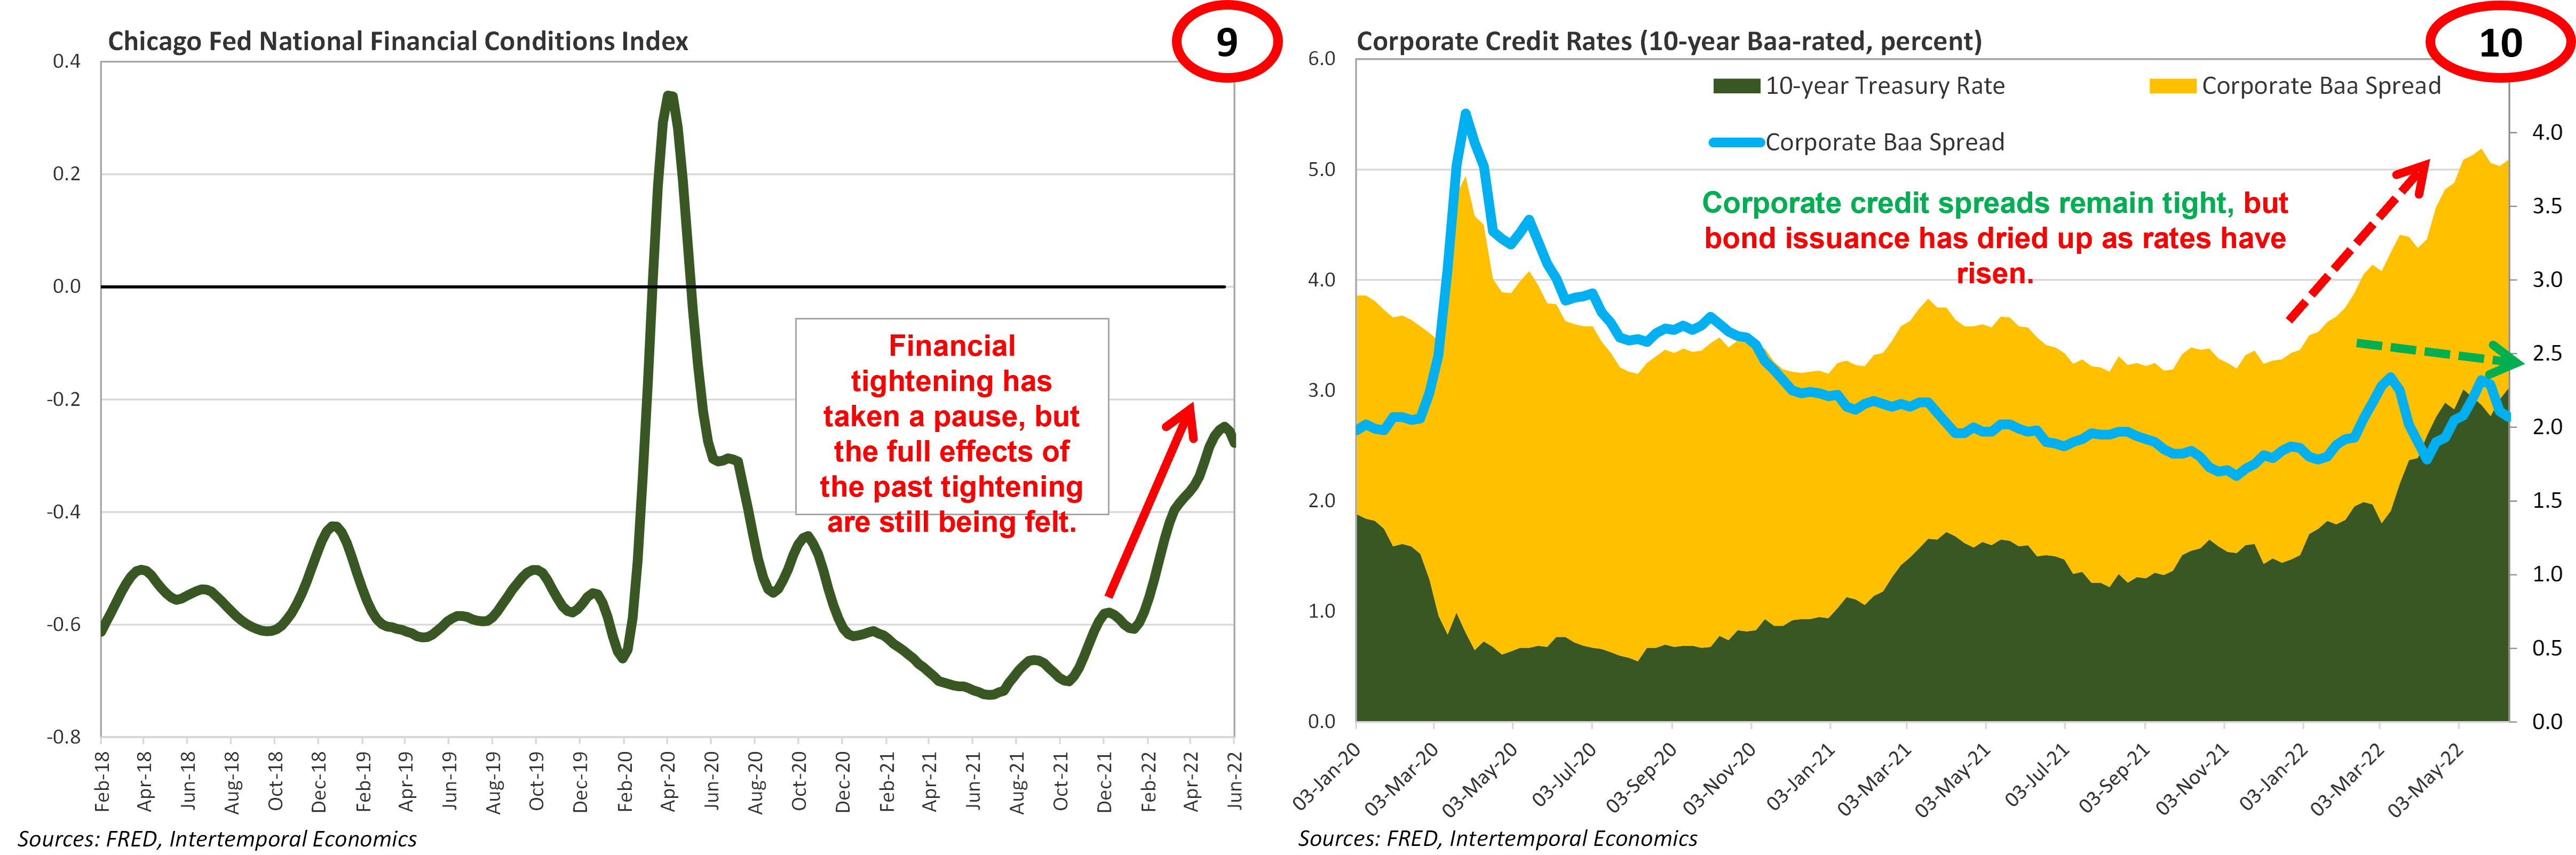
· Note that investment grade credit spreads have not widened, indicating that the bond market is not in the process of breaking down. However, credit creation for marginal borrowers, which drives booms is on the wane, as a result of the yield curve flattening (Charts 9 & 10).
· I do not expect any sort of “big bazooka” from the FOMC at the June meeting, but rather an attempt to calm the market by assuring everyone that – as always – the Fed stands ready to combat inflation, should expectations become entrenched. There might also be an initial attempt to shape the yield curve by hinting at adjustments to the reinvestment policy for bond maturities that exceed the monthly cap.
· Stocks to Watch: AZO, CPG, DDS, IBM, K, GILD, PBFX, PM, T, TMST, WMB
If you enjoyed reading this note please take the time to like, comment, or share - all three help immensely and I very much appreciate your thoughtfulness.


Mixed Inflation Signals
· For now, dollar inflows from commodity sales have kept emerging market currencies strong overall. Advanced economy currencies had been weakening on interest rate differentials, but tough talk by the ECB has reversed that trend. An important indicator of disinflation will be when the two sets of currencies cross as advanced economy policy tightening brings down commodity prices (Chart 11).
· Although energy and food prices have remained elevated on the back of geopolitical disruption, the GSCI commodity index has eased back, and unemployment claims are off record lows. The result is that the Yardini Boom/Bust Index is falling back from record levels (Chart 12). The Fed is hoping for a soft landing, but the current shape of the yield curve is hinting at stagflation.
· Note that although the nominal price of oil is very high, the price in gold terms is below levels seen in 2012/2013 (Chart 13). However, the gold price of oil has been rising fast and implies that further upward movement in the price of oil will trigger a major move upward in long-term nominal rates.
· The price of gold has been remarkably stable given how much real interest rates have moved (Chart 14). This implies the gold market is seeing past the taper tantrum and expecting real interest rates to fall either because inflation overshoots or because economic conditions weaken, and nominal rates fall.
Keep reading with a 7-day free trial
Subscribe to Capitalist Pig Collective to keep reading this post and get 7 days of free access to the full post archives.